Main Points
- The S&P 500 had great performance in the first half of 2023
- But the market had narrow leadership, with only 7 companies generating most of the gain
- When only a small proportion of companies have better performance than the index, the leaders tend to become laggards in the future
- Valuations for the top 7 stocks are stretched relative to the rest as well, another reason why today‘s 7 leaders could lag in performance in the future
The total return of the S&P 500 index in the first half of this year was a surprising 16.9%, the 2nd best first half for the index in the last 25 years[1]. At the same time, the “breadth” was terrible – the seven most valuable stocks had a fantastic first half while most other stocks muddled along. This lack of breadth has been noted as one reason for equity investors to worry, even as the S&P 500 returned to a technical bull market. Each of Magnificent Seven (M7) are great businesses and it’s understandable why they have become the most valuable companies in the US stock market. However, the usual outcome after periods of very low breadth has been that the stock market winners in the low breadth period lag the S&P 500 in the subsequent twelve months.
60% return for the M7
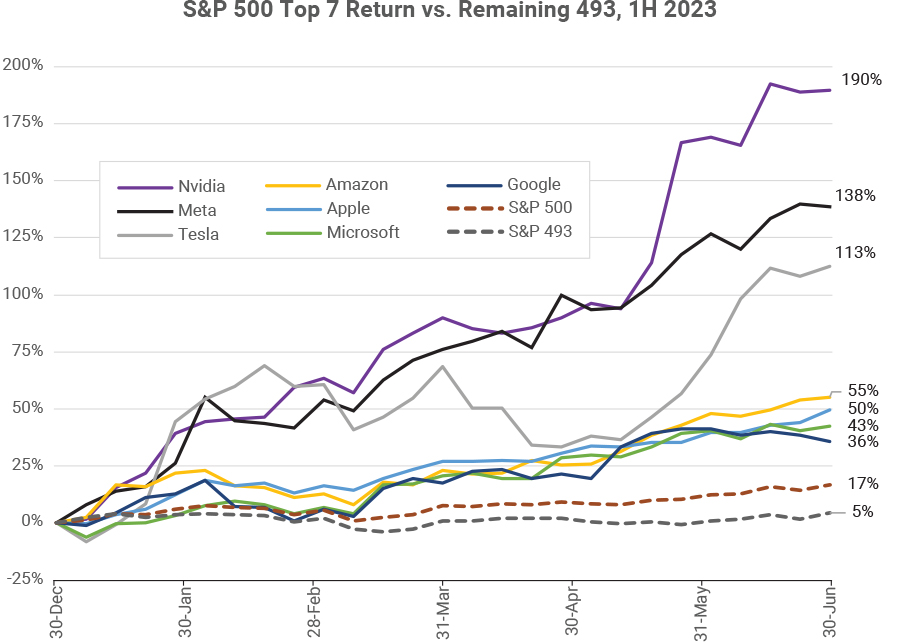
In the first half of 2023, M7 stocks had a weighted average return of 60%. This group raced away from the other 493 stocks in the index, which managed a much more modest return of 5%, on average. The M7 was responsible for 80% of the first half S&P 500 return.

Cap-weighted index trounced equal-weight in 1H
The weights of stocks in the S&P 500 index correspond with the market capitalization of the traded shares outstanding. Apple Computer, the first company to reach a $3 trillion market value (more than the combined value of the French and German stock markets), accounts for almost 8% of the index. Together, the seven stocks which led performance in the first half became nearly 30% of the S&P 500 index, up from 20% of the index in December 2022.
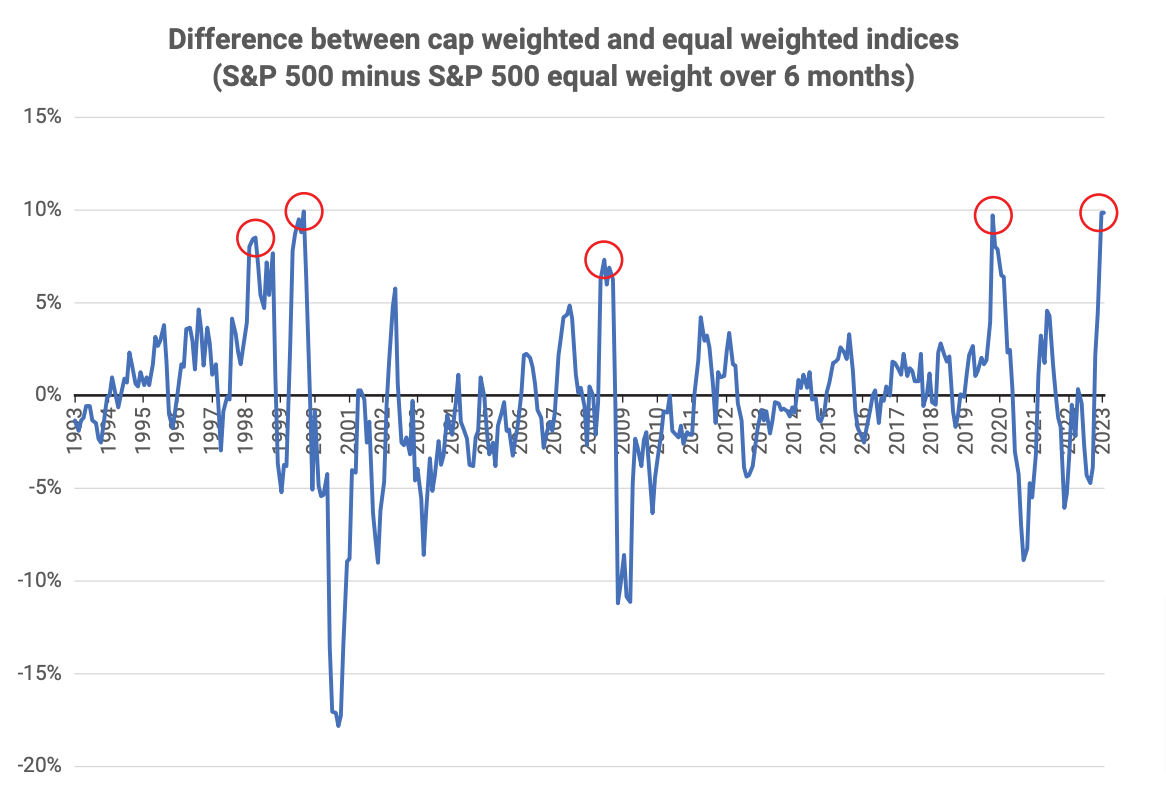
S&P Dow Jones Indices also produce an S&P 500 equal-weight index, where the index weight of each stock is set at 1/500 or 0.2%. In that index the combined M7 weight is just 1.4%, in contrast to the nearly 30% weight in the cap-weighted index. Over the long term, the performance of the two indices has been about the same. But in 1H 2023, the S&P 500 index outperformed the S&P 500 equal weight index by 10%, the largest gap in history (nearly matched in 2000 and 2020).

Previous peaks in the chart above (circled in red) came at turning points in the stock market – the fall of 1998 with the Russian debt and LTCM crises, the first quarter of 2000 – right before the technology stock crash, the last quarter of 2008 – at the start of the Global Financial Crisis, and March 2020 during the COVID crash. The current peak appears to share characteristics of the others in combining investor enthusiasm for new technologies (as in early 2000) and a desire by investors to hold the largest stocks as safe havens in uncertain times (as in 1998, 2008 and 2020).
We can observe that the highlighted periods in which the cap-weighted index had a much higher return than the equal-weighted index were followed by periods where the opposite was true. On average, when the six-month outperformance of the capitalization weighted index was 5% or more, the capitalization weighted index had a 7% lower return than the equal weighted index in the following twelve months. The Magnificent Seven are exceptionally strong and well-positioned, with differentiated products protected by significant barriers to entry. Perhaps they rightly deserve their valuation premiums; yet, history would expect them to be a drag on S&P 500 performance in the year ahead.
A divergence of P/E ratios
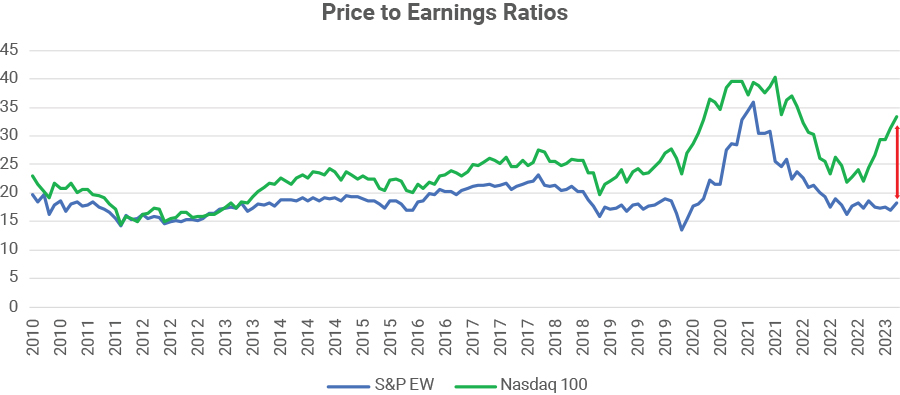
Elevated valuations are another reason why the large tech companies might underperform the rest in the future. Since the M7 stocks make up most of the market value of the Nasdaq 100 we use the Nasdaq 100 here as a proxy for the large tech companies and use the equal weight S&P 500 as the proxy for the US stock market in general. The chart shows the history of the price to earnings ratios of the S&P 500 equal weight index and the Nasdaq 100.

In the first half of 2023 there was an enormous divergence – the equal weight index remained at a P/E of about 18 while the P/E of the Nasdaq 100 skyrocketed from 22 to 33 – a 50% increase. The difference in P/E ratios now is by far the largest difference since 2010. More than all of the nearly 40% gain in the Nasdaq 100 since December is due to P/E expansion rather than higher earnings.
Differences in P/E ratios can be justified by differences in expected earnings growth rates. Perhaps the potential of Artificial Intelligence to be another source of earnings growth will be sufficient to sustain the current valuations of the largest companies. However, because the M7 are already the most valuable companies in the stock market, their sheer size is an impediment to continuing to achieve higher earnings growth than the smaller companies. Most of the companies which managed to become among the top ten most valuable in the past were unable to maintain their ranking going forward. For instance, Microsoft was the only company in the top ten in 1999 which was still in the top ten in 2009. Half of the Dow Jones Industrial Average stocks of 1999 are no longer in the DJIA index today.
Summary
Stock market returns in the first half of 2023 were dominated by seven large technology-oriented stocks. This led to a record high gap between the six-month performance of the S&P 500 capitalization-weighted index and the equal weight index. It also led to the largest spread between the P/E ratios of the Nasdaq 100 and the equal weight index of the past 20 years. Reversion to historical norms is a slow force, and not always reliable. But most stock market extremes eventually become less extreme. Should this happen, one should expect that on average the stocks which have been leading the S&P 500 so far this year will fall behind the performance of the index in the future.
[1] Source Bloomberg: The best first half in the past 20 years was 18.5% in 2021


Main Points
The total return of the S&P 500 index in the first half of this year was a surprising 16.9%, the 2nd best first half for the index in the last 25 years[1]. At the same time, the “breadth” was terrible – the seven most valuable stocks had a fantastic first half while most other stocks muddled along. This lack of breadth has been noted as one reason for equity investors to worry, even as the S&P 500 returned to a technical bull market. Each of Magnificent Seven (M7) are great businesses and it’s understandable why they have become the most valuable companies in the US stock market. However, the usual outcome after periods of very low breadth has been that the stock market winners in the low breadth period lag the S&P 500 in the subsequent twelve months.
60% return for the M7
In the first half of 2023, M7 stocks had a weighted average return of 60%. This group raced away from the other 493 stocks in the index, which managed a much more modest return of 5%, on average. The M7 was responsible for 80% of the first half S&P 500 return.
Cap-weighted index trounced equal-weight in 1H
The weights of stocks in the S&P 500 index correspond with the market capitalization of the traded shares outstanding. Apple Computer, the first company to reach a $3 trillion market value (more than the combined value of the French and German stock markets), accounts for almost 8% of the index. Together, the seven stocks which led performance in the first half became nearly 30% of the S&P 500 index, up from 20% of the index in December 2022.
S&P Dow Jones Indices also produce an S&P 500 equal-weight index, where the index weight of each stock is set at 1/500 or 0.2%. In that index the combined M7 weight is just 1.4%, in contrast to the nearly 30% weight in the cap-weighted index. Over the long term, the performance of the two indices has been about the same. But in 1H 2023, the S&P 500 index outperformed the S&P 500 equal weight index by 10%, the largest gap in history (nearly matched in 2000 and 2020).
Previous peaks in the chart above (circled in red) came at turning points in the stock market – the fall of 1998 with the Russian debt and LTCM crises, the first quarter of 2000 – right before the technology stock crash, the last quarter of 2008 – at the start of the Global Financial Crisis, and March 2020 during the COVID crash. The current peak appears to share characteristics of the others in combining investor enthusiasm for new technologies (as in early 2000) and a desire by investors to hold the largest stocks as safe havens in uncertain times (as in 1998, 2008 and 2020).
We can observe that the highlighted periods in which the cap-weighted index had a much higher return than the equal-weighted index were followed by periods where the opposite was true. On average, when the six-month outperformance of the capitalization weighted index was 5% or more, the capitalization weighted index had a 7% lower return than the equal weighted index in the following twelve months. The Magnificent Seven are exceptionally strong and well-positioned, with differentiated products protected by significant barriers to entry. Perhaps they rightly deserve their valuation premiums; yet, history would expect them to be a drag on S&P 500 performance in the year ahead.
A divergence of P/E ratios
Elevated valuations are another reason why the large tech companies might underperform the rest in the future. Since the M7 stocks make up most of the market value of the Nasdaq 100 we use the Nasdaq 100 here as a proxy for the large tech companies and use the equal weight S&P 500 as the proxy for the US stock market in general. The chart shows the history of the price to earnings ratios of the S&P 500 equal weight index and the Nasdaq 100.
In the first half of 2023 there was an enormous divergence – the equal weight index remained at a P/E of about 18 while the P/E of the Nasdaq 100 skyrocketed from 22 to 33 – a 50% increase. The difference in P/E ratios now is by far the largest difference since 2010. More than all of the nearly 40% gain in the Nasdaq 100 since December is due to P/E expansion rather than higher earnings.
Differences in P/E ratios can be justified by differences in expected earnings growth rates. Perhaps the potential of Artificial Intelligence to be another source of earnings growth will be sufficient to sustain the current valuations of the largest companies. However, because the M7 are already the most valuable companies in the stock market, their sheer size is an impediment to continuing to achieve higher earnings growth than the smaller companies. Most of the companies which managed to become among the top ten most valuable in the past were unable to maintain their ranking going forward. For instance, Microsoft was the only company in the top ten in 1999 which was still in the top ten in 2009. Half of the Dow Jones Industrial Average stocks of 1999 are no longer in the DJIA index today.
Summary
Stock market returns in the first half of 2023 were dominated by seven large technology-oriented stocks. This led to a record high gap between the six-month performance of the S&P 500 capitalization-weighted index and the equal weight index. It also led to the largest spread between the P/E ratios of the Nasdaq 100 and the equal weight index of the past 20 years. Reversion to historical norms is a slow force, and not always reliable. But most stock market extremes eventually become less extreme. Should this happen, one should expect that on average the stocks which have been leading the S&P 500 so far this year will fall behind the performance of the index in the future.
[1] Source Bloomberg: The best first half in the past 20 years was 18.5% in 2021
Share to Social Media!
Subscribe To Receive The Latest News
Related Posts
October 2024 Recap
September 2024 Recap
August 2024 Recap
July 2024 Stock Recap