What’s Discussed
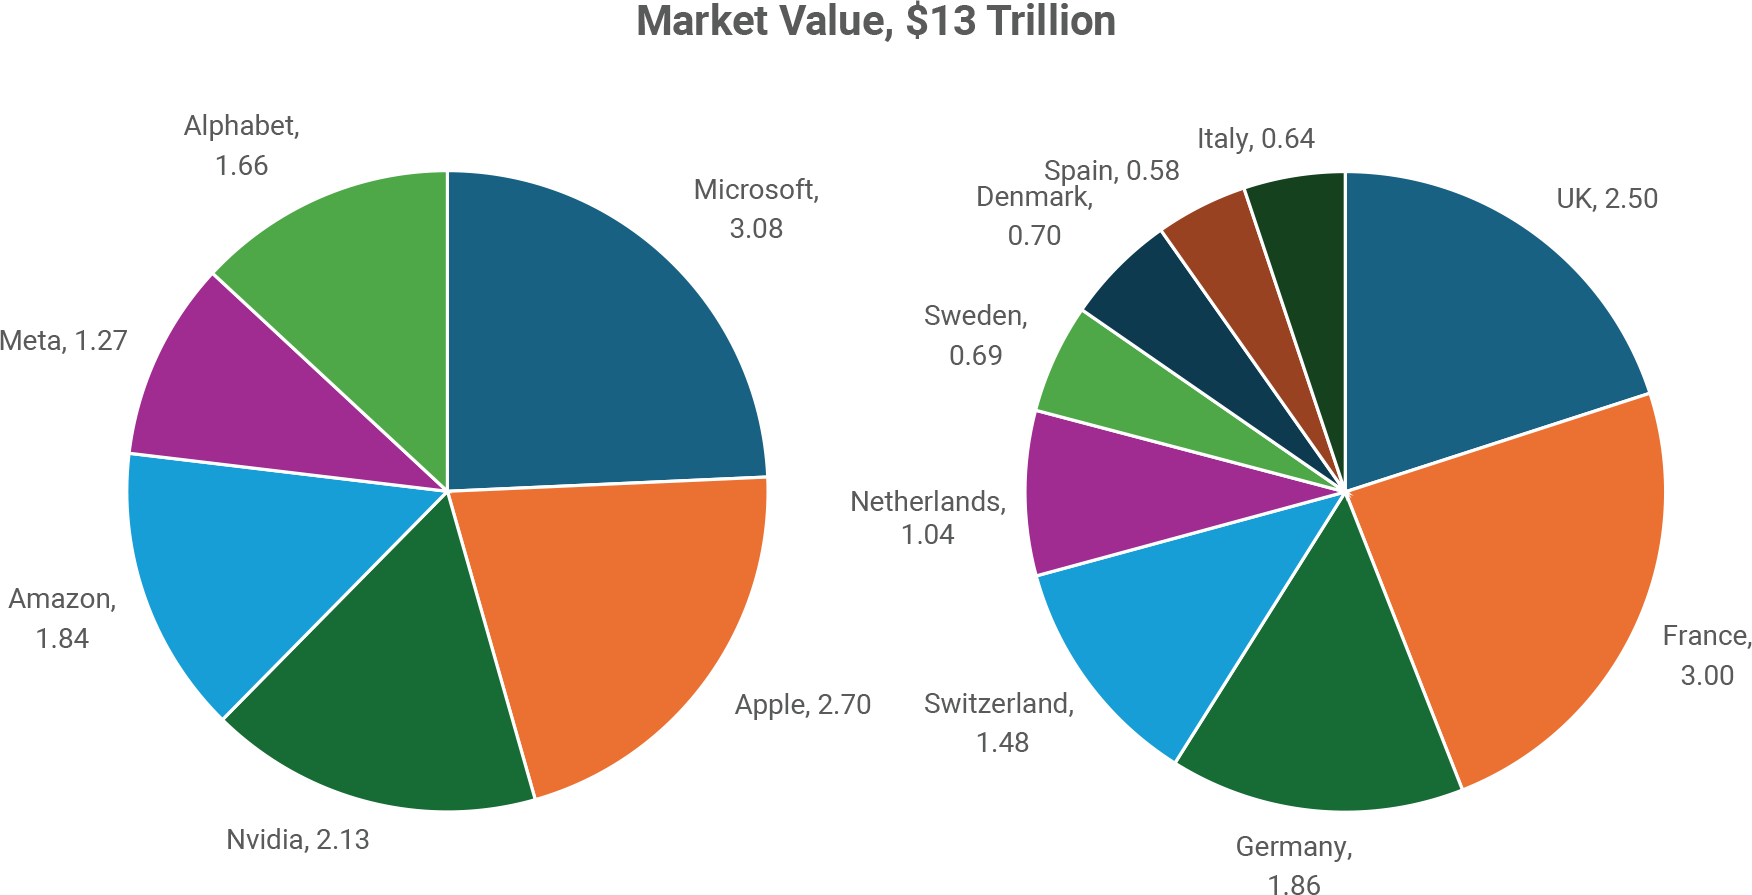
- With $13 trillion, you could buy all the shares of every large-cap public company in western Europe or alternatively the six most valuable companies in the US. Which is the better investment?
- Looking backwards, the six largest US companies have enjoyed much higher investment returns than Europe.
- As for the future, while no one can predict the timing, at some point we believe the laws of financial gravity will assert themselves.
Companies as Valuable as Entire Countries
The charts below show the market value, in trillions of dollars, of the six largest US companies and the nine largest European stock markets. At $3.1 trillion, the value of Microsoft alone exceeds the value of the entire stock market of any European country.

Unusual Outperformance by the Giant Companies
The Big Six became (or remained) the most valuable companies in the world due to years of exceptional price performance. As the chart indicates, in the last ten years the Big Six have trounced Europe by an enormous margin.

The powerful performance of the technology giants has led to an unusual outcome – the top ten most valuable US companies as a group have outperformed the S&P 500 by more than 4% per year in the last decade. This is unusual because normally the opposite is true – from 1957 to 2013 the top ten stocks underperformed the index by 4% per year. This is often referred to as “small cap premium” as it usually has been the case that small companies can grow faster than large companies (in percentage terms) as it becomes incrementally more difficult to grow earnings by another 10% when earnings are already immense. Clearly, this hasn’t been a problem lately, which brings us to…
Can the Biggest Stay on Top?
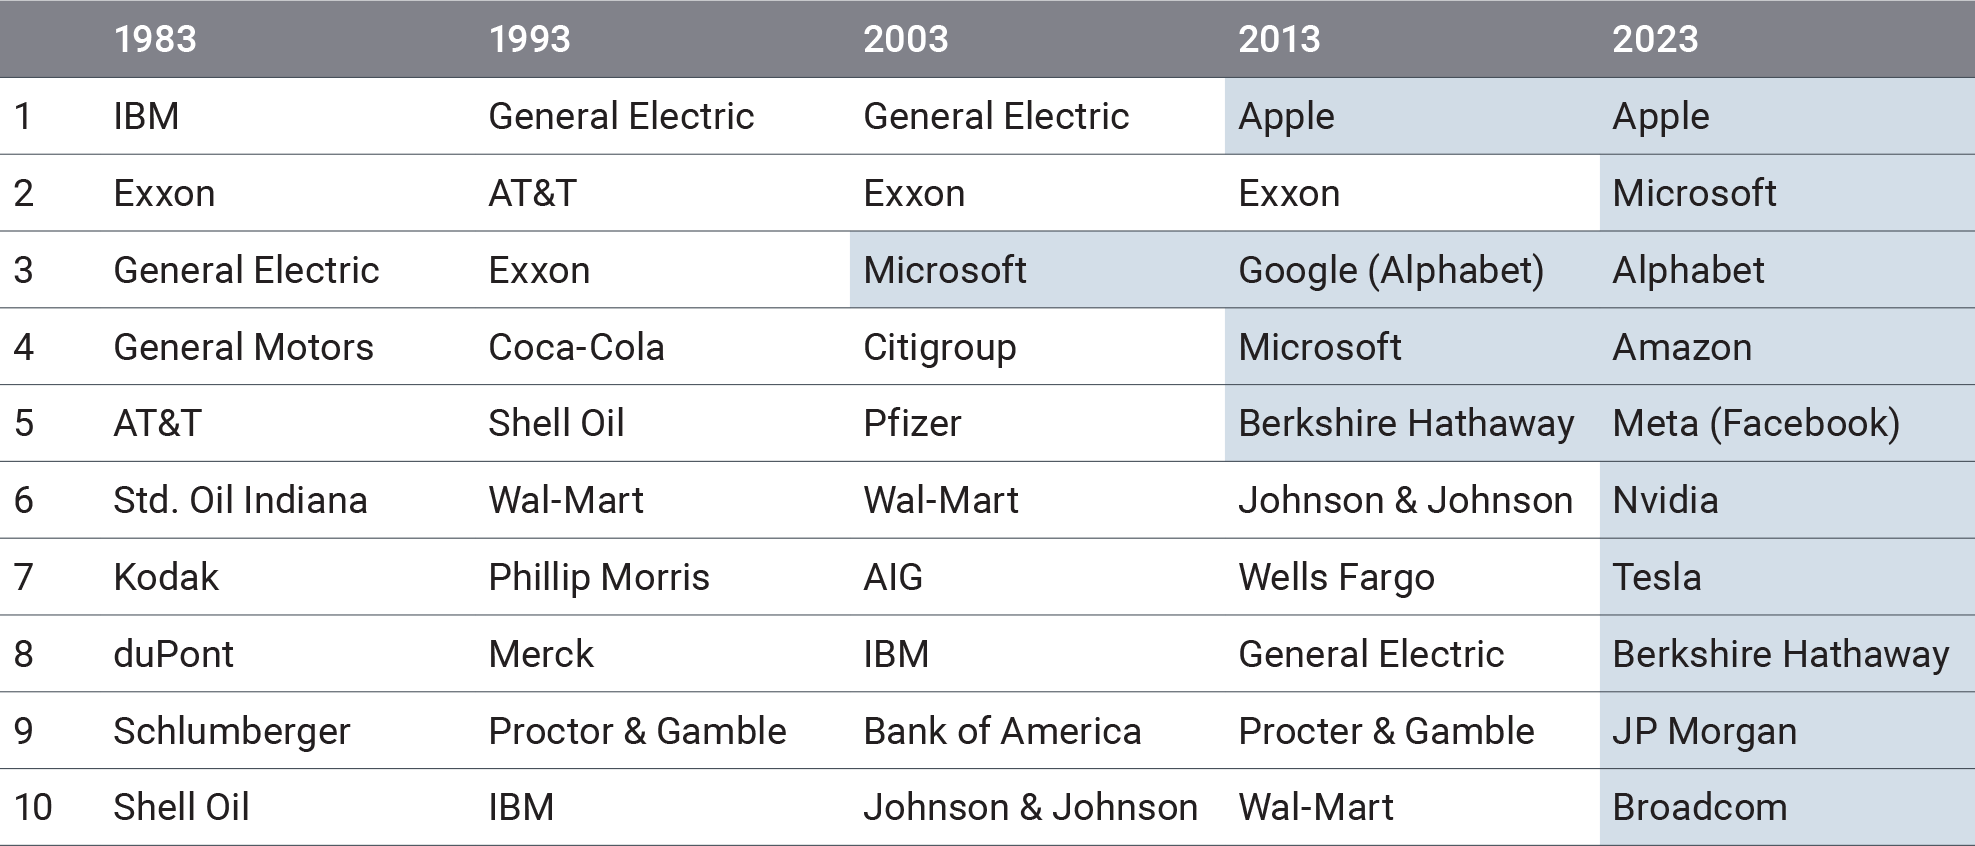
It is tough for the tallest trees to also be the trees with the largest percentage gain in height. That is why, as the table shows, there is a regular rotation in the list of the ten most valuable US companies. None of the top ten as of December 2023 were on the list 40 and 30 years earlier. Only Microsoft was on the list 20 years earlier.

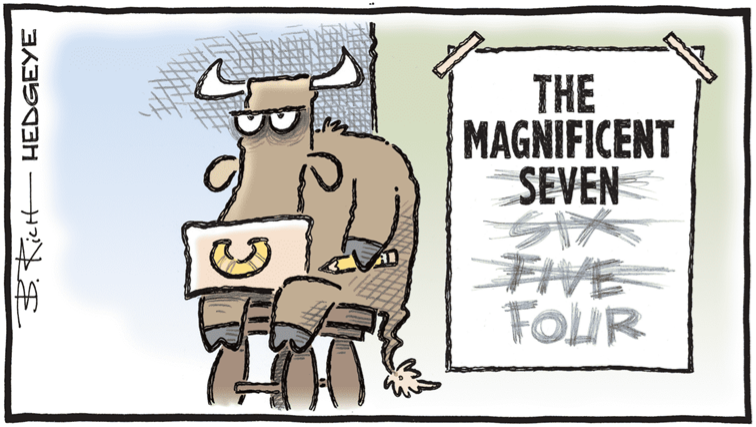
In this article, we are highlighting the Big Six. Last year, it was the Magnificent Seven, with Tesla included in the group. But Tesla’s revenue growth is slowing, and its earnings are falling. It is one of the worst performing stocks so far this year, on its way out of the top ten list. Apple is starting to falter as well, with revenue and earnings for 2024 not expected to be much higher than in 2023 or 2022. The stock is down more than 10% so far this year and it lost its crown as the world’s most valuable company to Microsoft. Alphabet has also lost some of its shine recently with stumbles in AI. The “Magnificent Seven” list could be shrinking.

As the case of Apple illustrates, when a company is already dominant in its industry, it can be difficult to become even more dominant. Domination also attracts the attention of regulators, as one can observe with the recent US Justice Department action against Apple.
Does Valuation Matter Anymore?
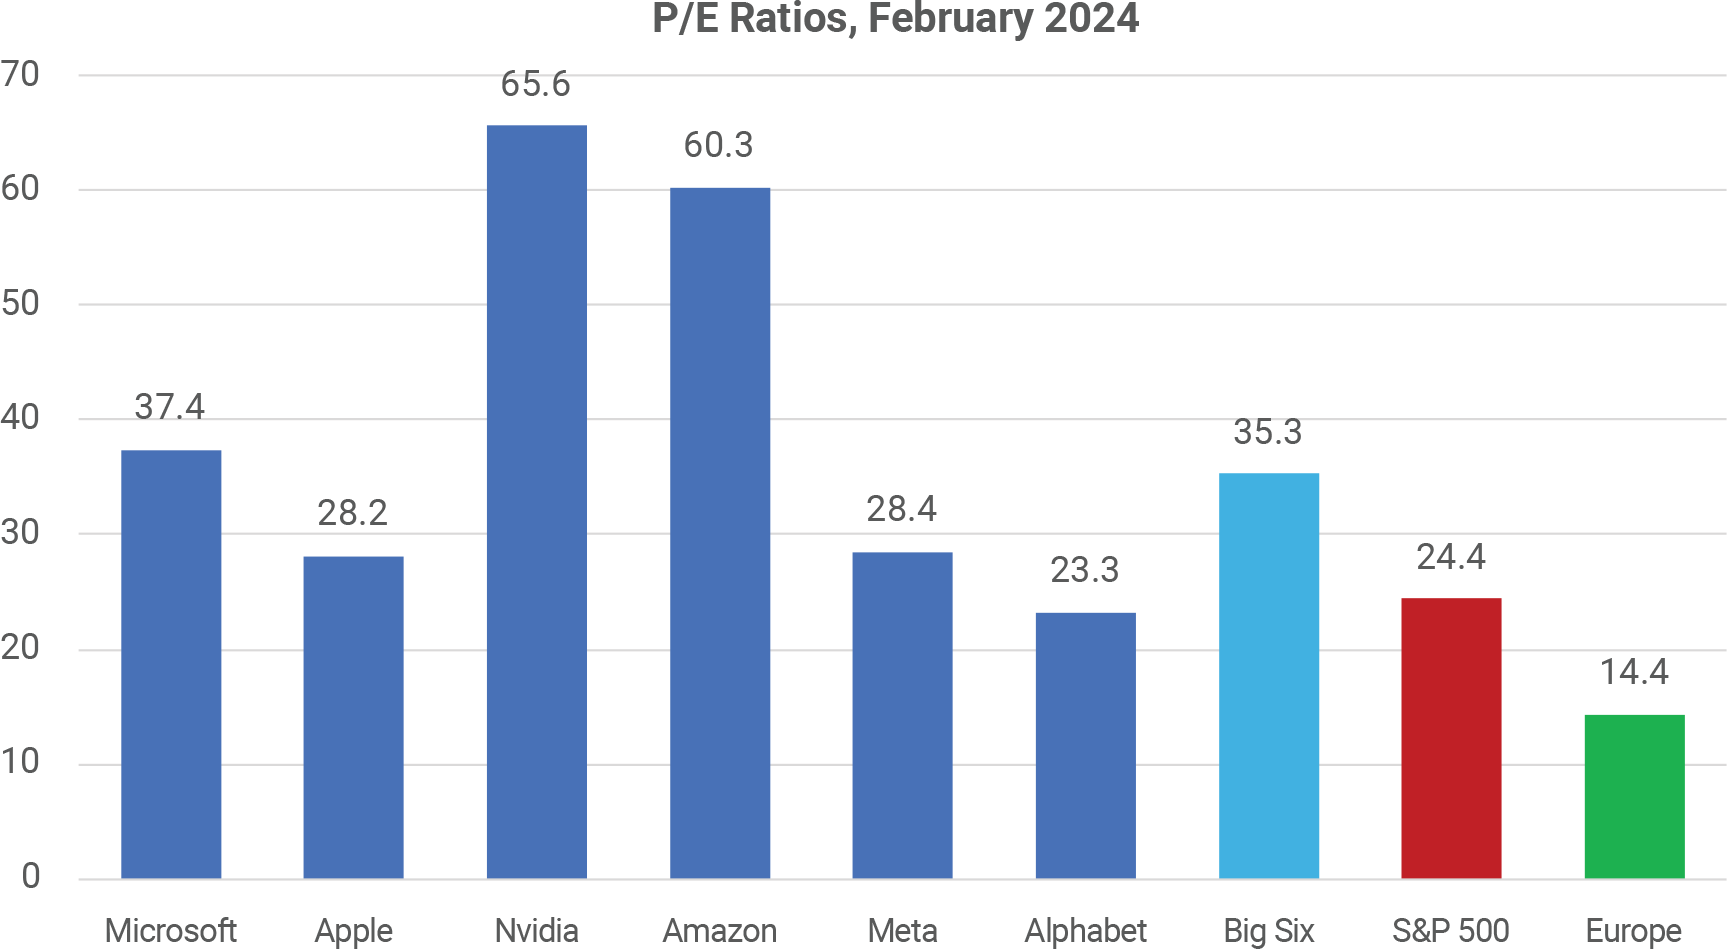
One factor in the strong performance of these stocks is the growth in P/E ratios, particularly for Microsoft and Apple, which each had P/E ratios below 12 ten years ago. As a group the Big Six have a current P/E of 35.3, which is an earnings yield of just 2.8%. For Europe, the P/E is 14.4 (earnings yield of 6.9%). For a $13 trillion investment, you can obtain $360 billion of trailing earnings from the Big Six, or nearly $1 trillion of earnings from all the European companies. The EPS growth for the Big Six needs to be much higher than Europe to make them be the better investment long-term.

Of course, we all know that enthusiasm for AI has lifted the prices of these stocks, and it seems likely that AI will be a profoundly useful technology. But, as with the internet, that doesn’t necessarily protect early investors from suffering painful losses along the way as businesses sort out ways to profit from the new technology.
What About Diversification and Risk?
The European composite contains 400 companies, a vastly more diversified portfolio than the Big Six. No more than 20% of the European weight is in any sector, while the Big Six are all technology companies with overlapping business interests. The annual price volatility of the Europe index over the past two years has been 19%, while it has been 30% for the Big Six.
Summary
As noted, the largest stocks have been winning for a while now. The commentary here about the valuation, diversification, and risk advantages of Europe over the Big Six would also have been valid at several other points over the past three years. It is not possible to identify the exact point when the Big Six will stop winning. The laws of financial gravity suggest there will eventually be a turning point. When that occurs, it will have a pronounced impact on stock market index outcomes because these six stocks are nearly 30% of the market value of the S&P 500.
Atlas Capital constructs diversified equity portfolios with a bias toward stocks with attractive valuation metrics. As a result of these preferences, we will typically tilt away from whichever companies are the “Big X” or “Magnificent Y” of the current era, especially if the valuation is poor. At this point, we believe Europe looks attractive relative to the Big Six. While this bias has not been advantageous in the last few years, financial market history suggests that diversification and value tend to lead to better investment outcomes over the long term.
Disclaimer
The information provided in this article by Atlas Capital Advisors Inc., a registered investment advisor (RIA), is intended for general informational purposes only and should not be considered as professional tax advice. While we strive to ensure the accuracy and timeliness of the content, tax laws are complex and subject to change. This article does not establish a client-advisor relationship, and individuals are encouraged to consult with qualified tax professionals for personalized advice tailored to their specific situations. Atlas Capital Advisors Inc. disclaims any responsibility for actions taken or not taken based on the information provided herein and makes no warranties regarding the accuracy or completeness of the content. The use of this information is at the reader’s own risk, and Atlas Capital Advisors Inc. is not liable for any direct or indirect damages arising from the use of this article.


What’s Discussed
Companies as Valuable as Entire Countries
The charts below show the market value, in trillions of dollars, of the six largest US companies and the nine largest European stock markets. At $3.1 trillion, the value of Microsoft alone exceeds the value of the entire stock market of any European country.
Unusual Outperformance by the Giant Companies
The Big Six became (or remained) the most valuable companies in the world due to years of exceptional price performance. As the chart indicates, in the last ten years the Big Six have trounced Europe by an enormous margin.
The powerful performance of the technology giants has led to an unusual outcome – the top ten most valuable US companies as a group have outperformed the S&P 500 by more than 4% per year in the last decade. This is unusual because normally the opposite is true – from 1957 to 2013 the top ten stocks underperformed the index by 4% per year. This is often referred to as “small cap premium” as it usually has been the case that small companies can grow faster than large companies (in percentage terms) as it becomes incrementally more difficult to grow earnings by another 10% when earnings are already immense. Clearly, this hasn’t been a problem lately, which brings us to…
Can the Biggest Stay on Top?
It is tough for the tallest trees to also be the trees with the largest percentage gain in height. That is why, as the table shows, there is a regular rotation in the list of the ten most valuable US companies. None of the top ten as of December 2023 were on the list 40 and 30 years earlier. Only Microsoft was on the list 20 years earlier.
In this article, we are highlighting the Big Six. Last year, it was the Magnificent Seven, with Tesla included in the group. But Tesla’s revenue growth is slowing, and its earnings are falling. It is one of the worst performing stocks so far this year, on its way out of the top ten list. Apple is starting to falter as well, with revenue and earnings for 2024 not expected to be much higher than in 2023 or 2022. The stock is down more than 10% so far this year and it lost its crown as the world’s most valuable company to Microsoft. Alphabet has also lost some of its shine recently with stumbles in AI. The “Magnificent Seven” list could be shrinking.
As the case of Apple illustrates, when a company is already dominant in its industry, it can be difficult to become even more dominant. Domination also attracts the attention of regulators, as one can observe with the recent US Justice Department action against Apple.
Does Valuation Matter Anymore?
One factor in the strong performance of these stocks is the growth in P/E ratios, particularly for Microsoft and Apple, which each had P/E ratios below 12 ten years ago. As a group the Big Six have a current P/E of 35.3, which is an earnings yield of just 2.8%. For Europe, the P/E is 14.4 (earnings yield of 6.9%). For a $13 trillion investment, you can obtain $360 billion of trailing earnings from the Big Six, or nearly $1 trillion of earnings from all the European companies. The EPS growth for the Big Six needs to be much higher than Europe to make them be the better investment long-term.
Of course, we all know that enthusiasm for AI has lifted the prices of these stocks, and it seems likely that AI will be a profoundly useful technology. But, as with the internet, that doesn’t necessarily protect early investors from suffering painful losses along the way as businesses sort out ways to profit from the new technology.
What About Diversification and Risk?
The European composite contains 400 companies, a vastly more diversified portfolio than the Big Six. No more than 20% of the European weight is in any sector, while the Big Six are all technology companies with overlapping business interests. The annual price volatility of the Europe index over the past two years has been 19%, while it has been 30% for the Big Six.
Summary
As noted, the largest stocks have been winning for a while now. The commentary here about the valuation, diversification, and risk advantages of Europe over the Big Six would also have been valid at several other points over the past three years. It is not possible to identify the exact point when the Big Six will stop winning. The laws of financial gravity suggest there will eventually be a turning point. When that occurs, it will have a pronounced impact on stock market index outcomes because these six stocks are nearly 30% of the market value of the S&P 500.
Atlas Capital constructs diversified equity portfolios with a bias toward stocks with attractive valuation metrics. As a result of these preferences, we will typically tilt away from whichever companies are the “Big X” or “Magnificent Y” of the current era, especially if the valuation is poor. At this point, we believe Europe looks attractive relative to the Big Six. While this bias has not been advantageous in the last few years, financial market history suggests that diversification and value tend to lead to better investment outcomes over the long term.
Disclaimer
The information provided in this article by Atlas Capital Advisors Inc., a registered investment advisor (RIA), is intended for general informational purposes only and should not be considered as professional tax advice. While we strive to ensure the accuracy and timeliness of the content, tax laws are complex and subject to change. This article does not establish a client-advisor relationship, and individuals are encouraged to consult with qualified tax professionals for personalized advice tailored to their specific situations. Atlas Capital Advisors Inc. disclaims any responsibility for actions taken or not taken based on the information provided herein and makes no warranties regarding the accuracy or completeness of the content. The use of this information is at the reader’s own risk, and Atlas Capital Advisors Inc. is not liable for any direct or indirect damages arising from the use of this article.
Share to Social Media!
Subscribe To Receive The Latest News
Related Posts
September 2024 Recap
August 2024 Recap
July 2024 Stock Recap
June 2024 Recap