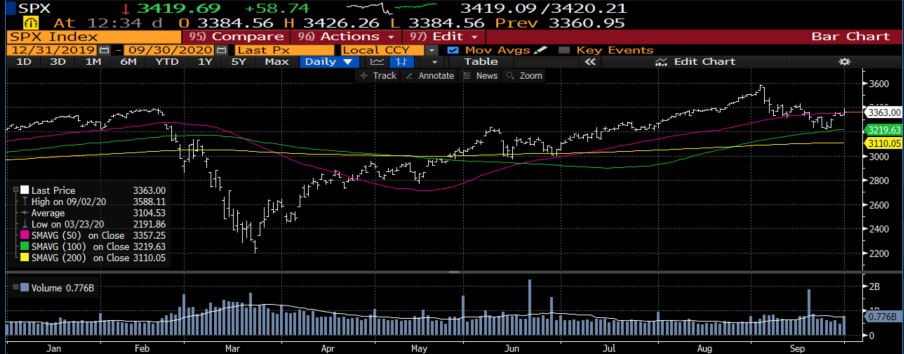
The S&P 500 Index is up a little over 5% through the first three quarters of the year. And as we all know, it’s been a fairly volatile ride with the market statistically entering both “Bear” and “Bull” market territory in the 1st half of the year. As a reminder, markets are deemed to be in a “Bear phase” once a 20% drawdown occurs. Conversely, a 20% rise has market participants happy they are in a “Bull phase”. Yes, it is rare for the market to have such volatility in such a short time frame.

2020 has been an equally remarkable investment year for what has transpired within traditional equity factor investment disciplines. Value tends to outperform Growth and Small capitalization tends to outperform Large capitalization. Not so lately. The top 5 largest companies in the S&P 500 (Apple, Amazon, Facebook, Google, Microsoft) so dominate in terms of performance and corresponding market size, that all other charts can be explained by this dynamic.
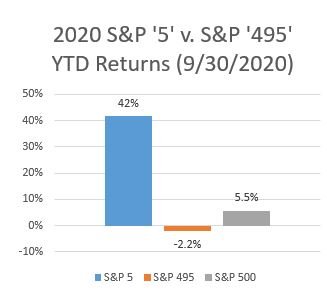
The market capitalization weighted index of these 5 companies has returned 42% YTD. The balance of the market, the remaining 495 companies that make up the bellwether S&P 500 market index, has returned -2.2% for the year.

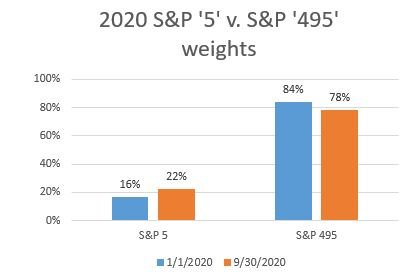
The proprietors of the S&P 500 index clearly want to have an index that is representative of the broad US economy. Standard & Poor’s qualitatively selects the 500 companies that comprise the index, but after that, it is a simple market capitalization weighted index. As it is currently configured, the 5 companies in question have risen from 16% of the index to representing a whopping 22%. The math is without question, but clearly, these 5 companies are not quite representative of the makeup of the US economy. We leave that for another discussion.

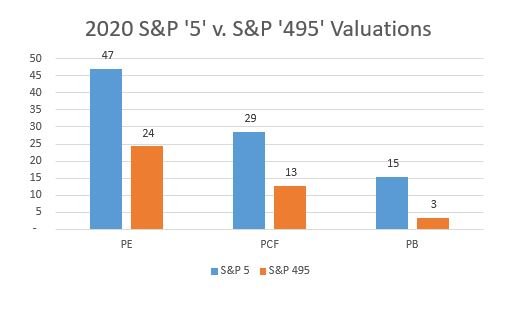
The performance of the “S&P 5”, not surprisingly, has skewed basic valuation metrics. Price/Earnings ratios are nearly twice the balance of the index’s constituents. Price-to-Cash Flow and Price-to-Book ratios are even more severely extreme versus “S&P 495” figures. Yes, the 5 companies have grown revenues at an astounding pace and the market clearly is rewarding these companies for their growth prospects. However, it is our opinion that something close to perfection is priced in. These are HUGE companies; a few extra billion in earnings will barely make a dent. As we’ve written before, the unprecedent liquidity provided by global central banks has contributed to this phenomenon as well as the historically low, and in some places, negative level of interest rates. With prospects for accelerated economic growth and inflation and US$ devaluation all relatively low, the party goes on… But, for how long?

Conclusions:
-
If you haven’t held sizeable positions in the S&P 5, you’ve probably underperformed the basic market benchmark
-
Stock prices are conceptually the net present value of discounted future cashflows; in the case of the S&P 5 – cashflows are becoming increasingly speculative
-
It’s naïve to think Congress won’t look at these companies in the same vain they looked at Standard Oil and the Railroad trusts in the early-1900s and more recently AT&T in the 1980s. These companies will face increasing pressure to breakup in order to loosen their growing monopolistic power. How that plays out is uncertain and markets usually hate uncertainty.

The S&P 500 Index is up a little over 5% through the first three quarters of the year. And as we all know, it’s been a fairly volatile ride with the market statistically entering both “Bear” and “Bull” market territory in the 1st half of the year. As a reminder, markets are deemed to be in a “Bear phase” once a 20% drawdown occurs. Conversely, a 20% rise has market participants happy they are in a “Bull phase”. Yes, it is rare for the market to have such volatility in such a short time frame.
2020 has been an equally remarkable investment year for what has transpired within traditional equity factor investment disciplines. Value tends to outperform Growth and Small capitalization tends to outperform Large capitalization. Not so lately. The top 5 largest companies in the S&P 500 (Apple, Amazon, Facebook, Google, Microsoft) so dominate in terms of performance and corresponding market size, that all other charts can be explained by this dynamic.
The market capitalization weighted index of these 5 companies has returned 42% YTD. The balance of the market, the remaining 495 companies that make up the bellwether S&P 500 market index, has returned -2.2% for the year.
The proprietors of the S&P 500 index clearly want to have an index that is representative of the broad US economy. Standard & Poor’s qualitatively selects the 500 companies that comprise the index, but after that, it is a simple market capitalization weighted index. As it is currently configured, the 5 companies in question have risen from 16% of the index to representing a whopping 22%. The math is without question, but clearly, these 5 companies are not quite representative of the makeup of the US economy. We leave that for another discussion.
The performance of the “S&P 5”, not surprisingly, has skewed basic valuation metrics. Price/Earnings ratios are nearly twice the balance of the index’s constituents. Price-to-Cash Flow and Price-to-Book ratios are even more severely extreme versus “S&P 495” figures. Yes, the 5 companies have grown revenues at an astounding pace and the market clearly is rewarding these companies for their growth prospects. However, it is our opinion that something close to perfection is priced in. These are HUGE companies; a few extra billion in earnings will barely make a dent. As we’ve written before, the unprecedent liquidity provided by global central banks has contributed to this phenomenon as well as the historically low, and in some places, negative level of interest rates. With prospects for accelerated economic growth and inflation and US$ devaluation all relatively low, the party goes on… But, for how long?
Conclusions:
If you haven’t held sizeable positions in the S&P 5, you’ve probably underperformed the basic market benchmark
Stock prices are conceptually the net present value of discounted future cashflows; in the case of the S&P 5 – cashflows are becoming increasingly speculative
It’s naïve to think Congress won’t look at these companies in the same vain they looked at Standard Oil and the Railroad trusts in the early-1900s and more recently AT&T in the 1980s. These companies will face increasing pressure to breakup in order to loosen their growing monopolistic power. How that plays out is uncertain and markets usually hate uncertainty.
Share to Social Media!
Subscribe To Receive The Latest News
Related Posts
June 2024 Recap
May 2024 Recap
April 2024 Recap
March 2024 Recap