Historically, the bottoms of equity bear markets have been terrific times to re-enter the market. The average gain from the bottom price of an S&P 500 bear market has been quite large: 37% over one year and 52% over two years![1] These recoveries from bear markets happen quickly, so it is useful to be prepared to exploit them.
So, are we there yet?
Not quite. For confident re-entry into the stock market, we await a combination of the following:
- Equities cheapen relative to bonds
- Inflation rate clearly falling
- Global economy passes its worst point of this downturn
- Federal Reserve policy pivots away from inflation-fighting toward supporting economic growth
Of these four, central bank policy is the most important. It will be hard for stocks to sustain a rally while the Fed continues to raise interest rates. Most of the “bear rally” from mid-June to mid-August happened when the market incorrectly predicted that the Fed would pivot by year-end, only to be disappointed when the Fed indicated that was unlikely. When the Fed confirms a pivot, the global economy will likely be in bad shape. Nonetheless, that policy change could well be a sign that it has become safer to add back to equity holdings.
S&P 500 Bear Markets
The current bear market is the 20th time since 1880 that the S&P 500 has fallen at least 20%. According to Bank of America research, the average loss in these bear markets was 36%. The median length of a bear market was about a year and a half.
The following chart shows the S&P 500 index price for the past century (log scale). Each of the dates where the S&P 500 reached the bottom price of a bear market is highlighted with a vertical red line. US recession periods are also highlighted in grey. Most of the US bear markets have corresponded with recessions. In most cases, the bottom price occurred during or after the recession.
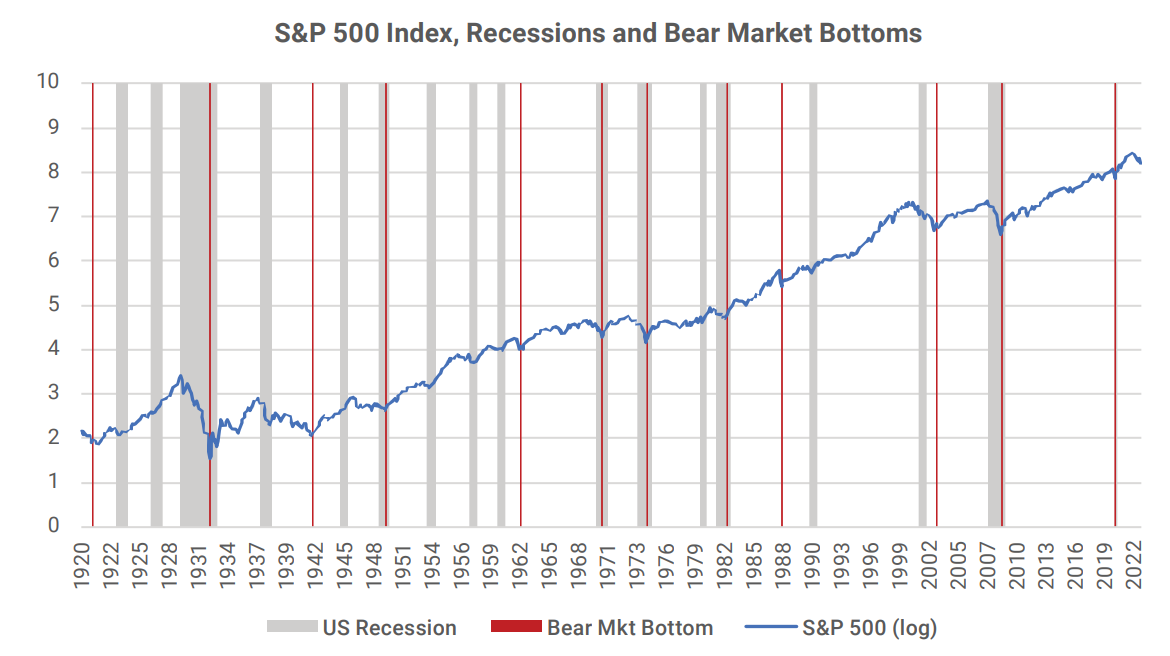
From the Fed’s perspective an equity bear market is a form of financial tightening (cost of capital going up), which contributes to the economic impact of the tightening the Fed is doing itself through higher interest rates. The Fed is also watching the “wealth effect,” whereby lower stock prices lead to less consumer spending. Bear market rallies relieve pressure on the Fed to pivot, while a continuation of the current bear market would increase that pressure.
Equity Valuation
Equity valuation is often the most talked about, yet the most unreliable in explaining market expectations. Here, we are not going to engage in the arguments regarding whether the current 16X forward price/earnings ratio is good or bad. It is more reliable to examine the earnings yield relative to bond yields. A distinctive feature of the bear markets of the past is that they ended when equities quickly cheapened relative to bonds. That has not yet happened this year.
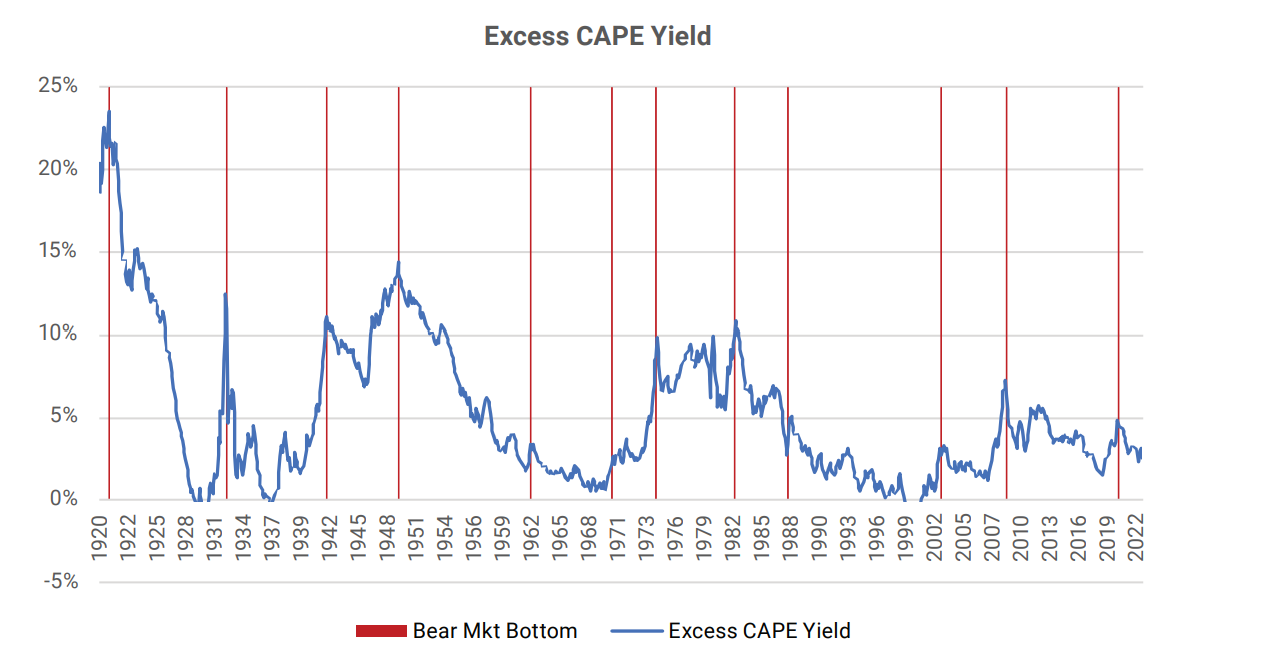
The following chart shows the excess Cyclically Adjusted Price Earnings (CAPE) yield of US equities over the past century.[2] The CAPE yield is the average real earnings of the S&P 500 over the past ten years divided by the current index price. The excess CAPE yield is the CAPE yield less the real ten-year US treasury yield. When the blue line on the following chart is low, stocks are expensive – they do not offer a very good return relative to bonds. When the blue line is high, stock prices are more attractive relative to bonds.
There has always been a period toward the end of the past bear markets where the earnings yield on stocks rose faster than the real yield on ten-year Treasury bonds. In the chart, we can see spikes in the blue line coinciding with the bear market bottom dates. But there is not yet any rise in the blue line this year. Even with the big decline in the S&P 500 index price so far this year, the increase in the equity earnings yield has not kept up with the increase in US treasury yields. Stocks are still not cheap relative to bonds, so this signal for the end of a bear market has not yet been triggered.
Inflation
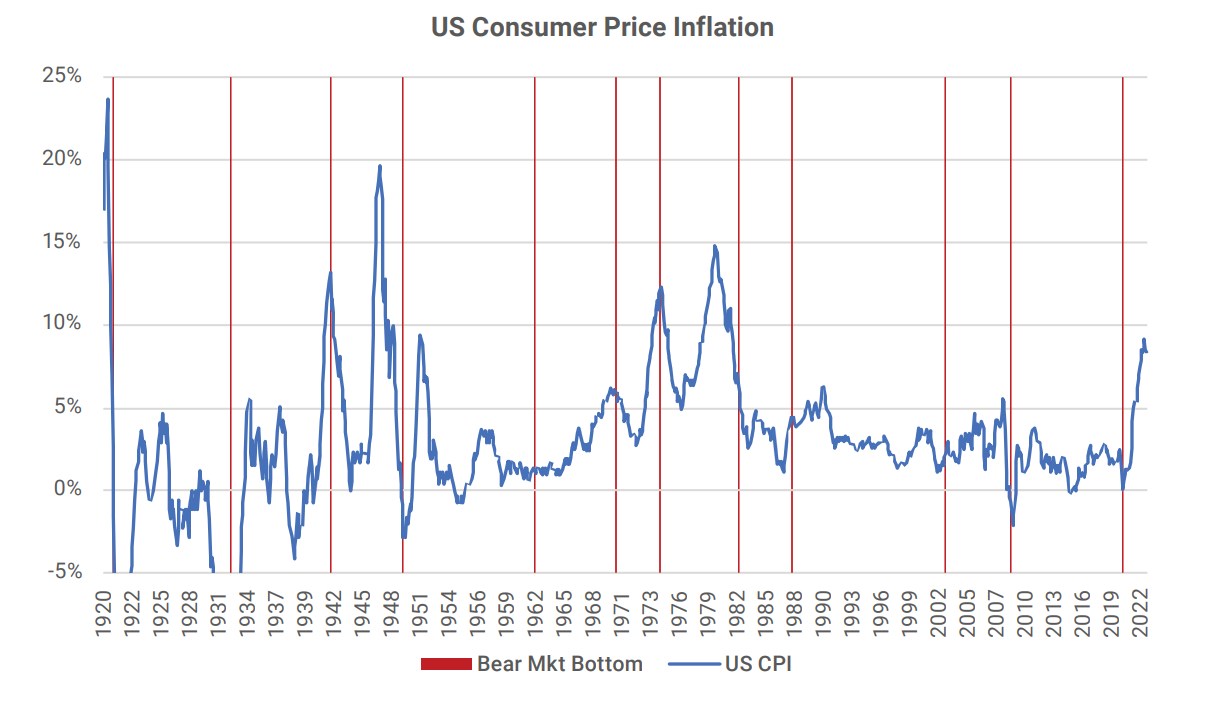
High and rising inflation is an important contributor to the current bear market. We can see in the chart below[3], most of the times that inflation rose over 5% there was an equity bear market, and in each case the end of the bear market occurred at or after the point of peak inflation. Note that inflation can still be quite high when the stock market starts recovering, as in 1974. The key is whether inflation is rising or falling. This year, US CPI reached 9.1% in June and has since declined. If the June reading is indeed the high point, as seems likely, we can check this one off our list. This prerequisite for a stock market recovery would be in place.
Economic Growth
Another important contributor to the current bear market is the weakening of the global economy. The enormous fiscal and monetary stimulus of the early COVID era is in reverse, with the economic surge giving way to economic decline. We believe the US is likely to enter into a recession in the next few quarters.
In the chart below, the blue line is the percentage of global economic data which improved in the past year. Usually, the bear market ends when the economic data are at or past their worst point (blue line at a low). If the bear market coincides with a recession, the end of the bear market typically happens around or after the worst point of the recession.
The blue line indicating global economic health has been steadily falling for more than a year. At this point, only 28% of the economic data we track improved in the past year. We want to see that metric start to improve before we are comfortable adding to equity risk.

Federal Reserve Policy
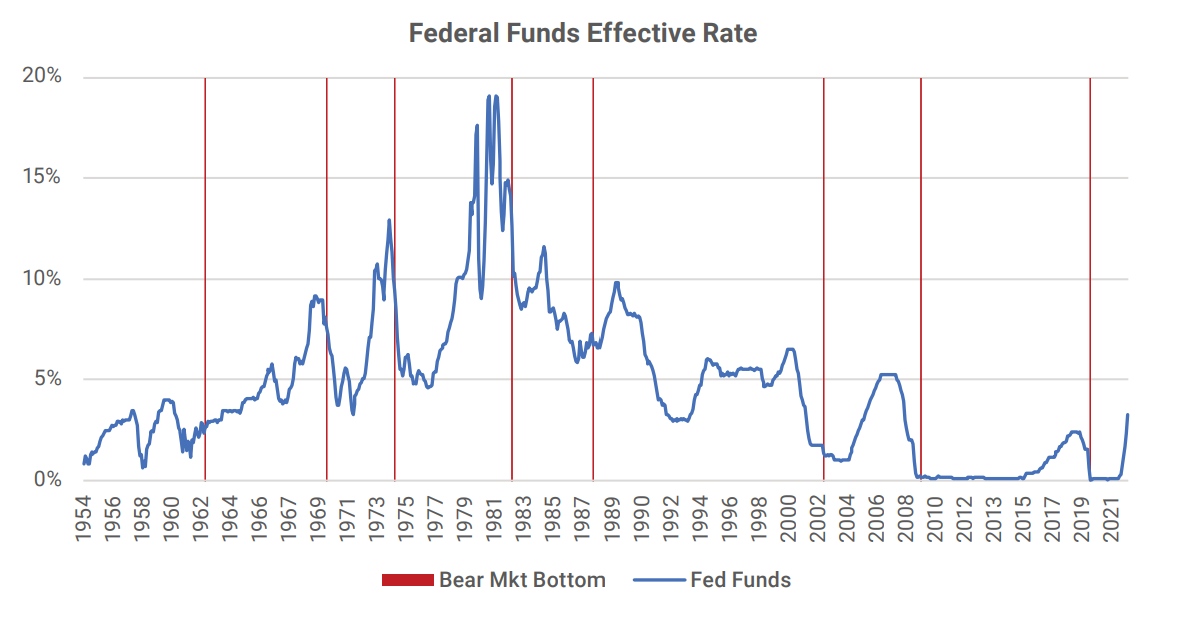
The slump in economic data is a consequence of monetary tightening around the world. The chart below[4] shows the effective Fed Funds rate since 1954. We can see that bear market bottoms happen when the Fed Funds rate is stable or falling. They have not occurred while short-term interest rates are still going up, as they are now.
Summary
Everyone is waiting for the opportunity to buy at the stock market bottom. So, are we there yet? It looks like the inflation rate is starting to fall, which is a positive factor for the equity market. However, that is not enough. Stocks have not yet become cheap relative to bonds, the global economy continues to weaken and central banks are still raising short-term interest rates. When the Fed indicates they have become more alarmed about the economy than inflation, that would likely be the point that we can become less alarmed about what is next for our stock holdings.
[1] Source, Michael Hartnett, Bank of America research, “The Flow Show”, September 30, 2022, evaluation of bear markets (losses of 20% or more) from 1880 to present.
[2] Source: Robert Shiller dataset, http://www.econ.yale.edu/~shiller/data.htm
[3] Source: Robert Shiller dataset, http://www.econ.yale.edu/~shiller/data.htm
[4] Source: Bloomberg, FEDL01 Index


Historically, the bottoms of equity bear markets have been terrific times to re-enter the market. The average gain from the bottom price of an S&P 500 bear market has been quite large: 37% over one year and 52% over two years![1] These recoveries from bear markets happen quickly, so it is useful to be prepared to exploit them.
So, are we there yet?
Not quite. For confident re-entry into the stock market, we await a combination of the following:
Of these four, central bank policy is the most important. It will be hard for stocks to sustain a rally while the Fed continues to raise interest rates. Most of the “bear rally” from mid-June to mid-August happened when the market incorrectly predicted that the Fed would pivot by year-end, only to be disappointed when the Fed indicated that was unlikely. When the Fed confirms a pivot, the global economy will likely be in bad shape. Nonetheless, that policy change could well be a sign that it has become safer to add back to equity holdings.
S&P 500 Bear Markets
The current bear market is the 20th time since 1880 that the S&P 500 has fallen at least 20%. According to Bank of America research, the average loss in these bear markets was 36%. The median length of a bear market was about a year and a half.
The following chart shows the S&P 500 index price for the past century (log scale). Each of the dates where the S&P 500 reached the bottom price of a bear market is highlighted with a vertical red line. US recession periods are also highlighted in grey. Most of the US bear markets have corresponded with recessions. In most cases, the bottom price occurred during or after the recession.
From the Fed’s perspective an equity bear market is a form of financial tightening (cost of capital going up), which contributes to the economic impact of the tightening the Fed is doing itself through higher interest rates. The Fed is also watching the “wealth effect,” whereby lower stock prices lead to less consumer spending. Bear market rallies relieve pressure on the Fed to pivot, while a continuation of the current bear market would increase that pressure.
Equity Valuation
Equity valuation is often the most talked about, yet the most unreliable in explaining market expectations. Here, we are not going to engage in the arguments regarding whether the current 16X forward price/earnings ratio is good or bad. It is more reliable to examine the earnings yield relative to bond yields. A distinctive feature of the bear markets of the past is that they ended when equities quickly cheapened relative to bonds. That has not yet happened this year.
The following chart shows the excess Cyclically Adjusted Price Earnings (CAPE) yield of US equities over the past century.[2] The CAPE yield is the average real earnings of the S&P 500 over the past ten years divided by the current index price. The excess CAPE yield is the CAPE yield less the real ten-year US treasury yield. When the blue line on the following chart is low, stocks are expensive – they do not offer a very good return relative to bonds. When the blue line is high, stock prices are more attractive relative to bonds.
There has always been a period toward the end of the past bear markets where the earnings yield on stocks rose faster than the real yield on ten-year Treasury bonds. In the chart, we can see spikes in the blue line coinciding with the bear market bottom dates. But there is not yet any rise in the blue line this year. Even with the big decline in the S&P 500 index price so far this year, the increase in the equity earnings yield has not kept up with the increase in US treasury yields. Stocks are still not cheap relative to bonds, so this signal for the end of a bear market has not yet been triggered.
Inflation
High and rising inflation is an important contributor to the current bear market. We can see in the chart below[3], most of the times that inflation rose over 5% there was an equity bear market, and in each case the end of the bear market occurred at or after the point of peak inflation. Note that inflation can still be quite high when the stock market starts recovering, as in 1974. The key is whether inflation is rising or falling. This year, US CPI reached 9.1% in June and has since declined. If the June reading is indeed the high point, as seems likely, we can check this one off our list. This prerequisite for a stock market recovery would be in place.
Economic Growth
Another important contributor to the current bear market is the weakening of the global economy. The enormous fiscal and monetary stimulus of the early COVID era is in reverse, with the economic surge giving way to economic decline. We believe the US is likely to enter into a recession in the next few quarters.
In the chart below, the blue line is the percentage of global economic data which improved in the past year. Usually, the bear market ends when the economic data are at or past their worst point (blue line at a low). If the bear market coincides with a recession, the end of the bear market typically happens around or after the worst point of the recession.
The blue line indicating global economic health has been steadily falling for more than a year. At this point, only 28% of the economic data we track improved in the past year. We want to see that metric start to improve before we are comfortable adding to equity risk.
Federal Reserve Policy
The slump in economic data is a consequence of monetary tightening around the world. The chart below[4] shows the effective Fed Funds rate since 1954. We can see that bear market bottoms happen when the Fed Funds rate is stable or falling. They have not occurred while short-term interest rates are still going up, as they are now.
Summary
Everyone is waiting for the opportunity to buy at the stock market bottom. So, are we there yet? It looks like the inflation rate is starting to fall, which is a positive factor for the equity market. However, that is not enough. Stocks have not yet become cheap relative to bonds, the global economy continues to weaken and central banks are still raising short-term interest rates. When the Fed indicates they have become more alarmed about the economy than inflation, that would likely be the point that we can become less alarmed about what is next for our stock holdings.
[1] Source, Michael Hartnett, Bank of America research, “The Flow Show”, September 30, 2022, evaluation of bear markets (losses of 20% or more) from 1880 to present.
[2] Source: Robert Shiller dataset, http://www.econ.yale.edu/~shiller/data.htm
[3] Source: Robert Shiller dataset, http://www.econ.yale.edu/~shiller/data.htm
[4] Source: Bloomberg, FEDL01 Index
Share to Social Media!
Subscribe To Receive The Latest News
Related Posts
September 2024 Recap
August 2024 Recap
July 2024 Stock Recap
June 2024 Recap