What’s Discussed
This paper on venture capital investing is the second of a series on alternative investments[1]. The alternatives industry is making a concerted effort to gather more assets from individuals due to declining appetite from institutional investors. The purpose of the series is to help individual investors recognize the drawbacks of alternative investments before plunging in. If you are considering venture capital for your portfolio, you should be aware of the following issues:
- Net venture capital investment returns, on average, have been lower than the returns of public equity technology indices.
- The high fee burden, particularly for funds of funds, detracts from venture outcomes.
- Venture firms and their investors engage in destructive pro-cyclical behavior – overinvesting at high prices in exuberant times.
- There are severe liquidity strains in the venture capital ecosystem – a rapidly growing number of venture-backed companies facing a shrinking exit window.
- It’s quite difficult for individuals to gain access to the best venture funds.
- Success in venture investing requires organizational capabilities and access that, for the most part, are not available to individuals or their representatives and advisors.
Venture Capital Returns Below Public Equity Equivalents
On average, venture investors have not been compensated for the additional risk they take. The true volatility of venture investing is obscured by the smoothing of reported returns. In reality, based on the price volatility of public companies with similar characteristics to venture start-up companies, venture investments are at least 60% more volatile than investments in the Nasdaq 100 index.
If we expect our Nasdaq 100 investments to earn 5% over cash, we should get 8% over cash from our venture investments to obtain fair compensation for the additional risk. In fact, over the past ten and twenty years, venture investments on average have delivered lower returns than the Nasdaq 100.
The chart below shows the ten-year annualized return through September 2023 for three venture indices and three public market benchmarks[2]. The three venture indices show annual returns in the range of 12.6% to 16.9%. Note that the returns reported by venture managers likely overstate the actual returns because they are based on internal rates of return (IRRs), which can be manipulated and rely on subjective judgments of market valuations.
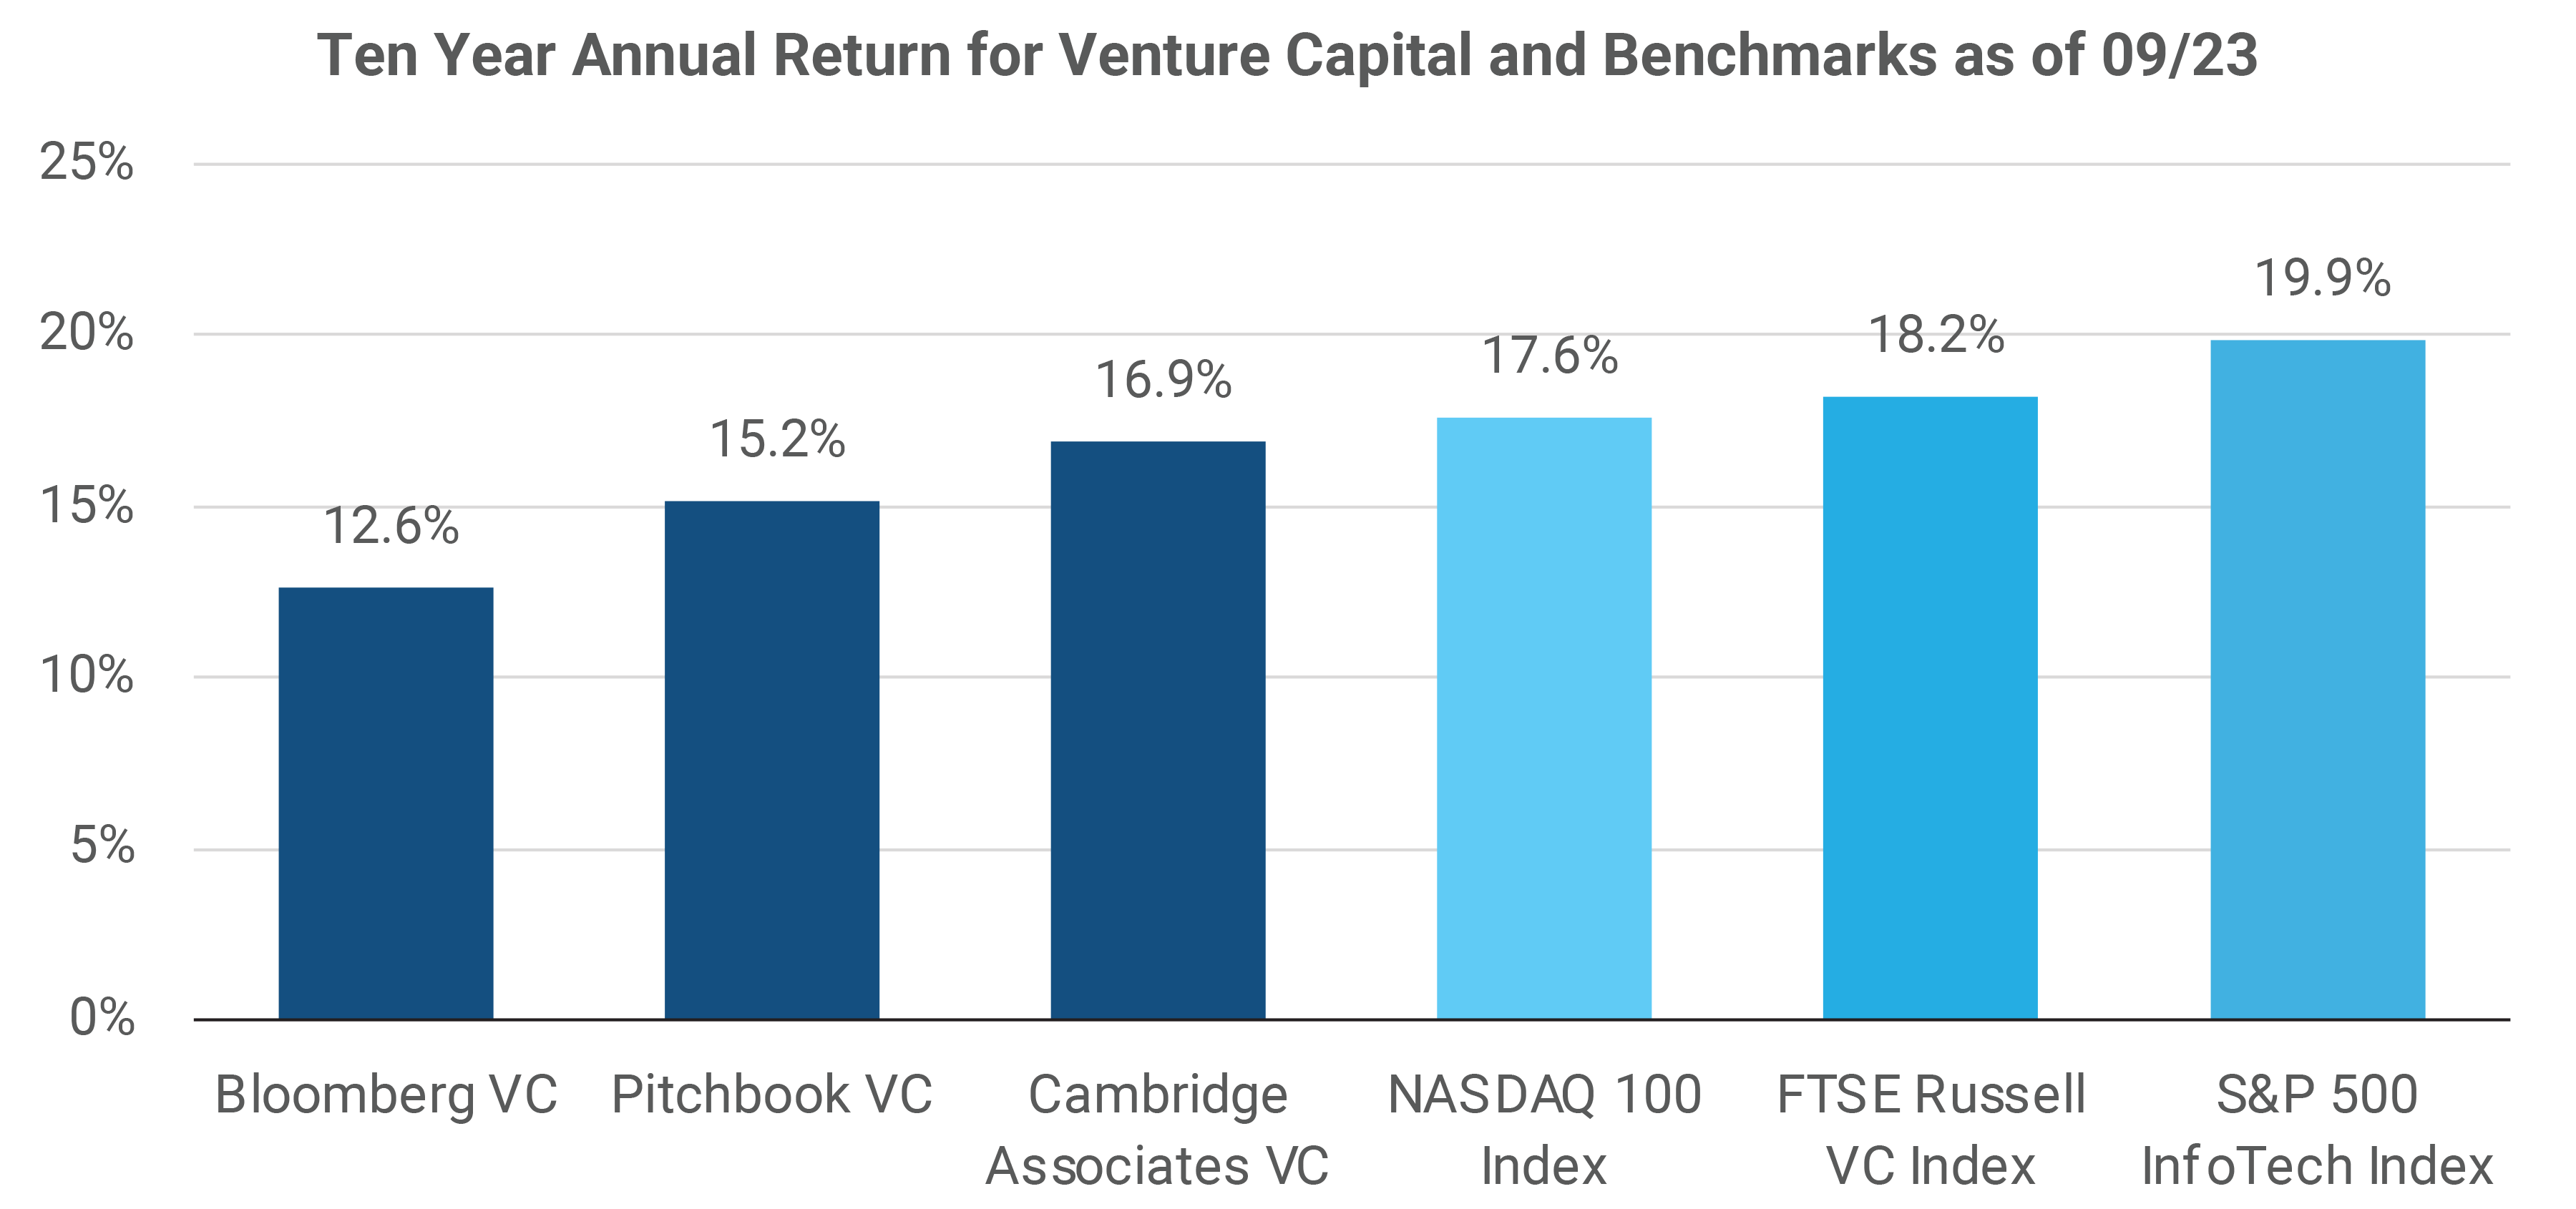
For investors who like the return and risk profile of venture investing without the fees and illiquidity, the FTSE Russell Venture Capital Index[3] attempts to mirror the sector and risk profile of venture investing via investments in stocks of public companies. The index has an 18.2%/year return for the ten years ended September 2023, despite a staggering 60% drawdown from late 2021 to mid-2022.
Venture investing underperformed technology investment indices in the past twenty years as well. According to Cambridge Associates, the 20-year venture return through September 2023 was 12.3% per year, which is below the 13.8%/year return of the NASDAQ 100, the 13.6% return of the S&P 500 InfoTech sector, or the 15.2%/year return of the FTSE Russell Venture Capital Index.
Manager Fees Impact Performance
The fees paid to venture managers are an important reason why the risk-adjusted outcomes of venture investing have been disappointing. Venture capital firms typically charge a 2% management fee plus a carried interest of 20% of investment returns. Some top tier firms charge even more than 2%/20%.
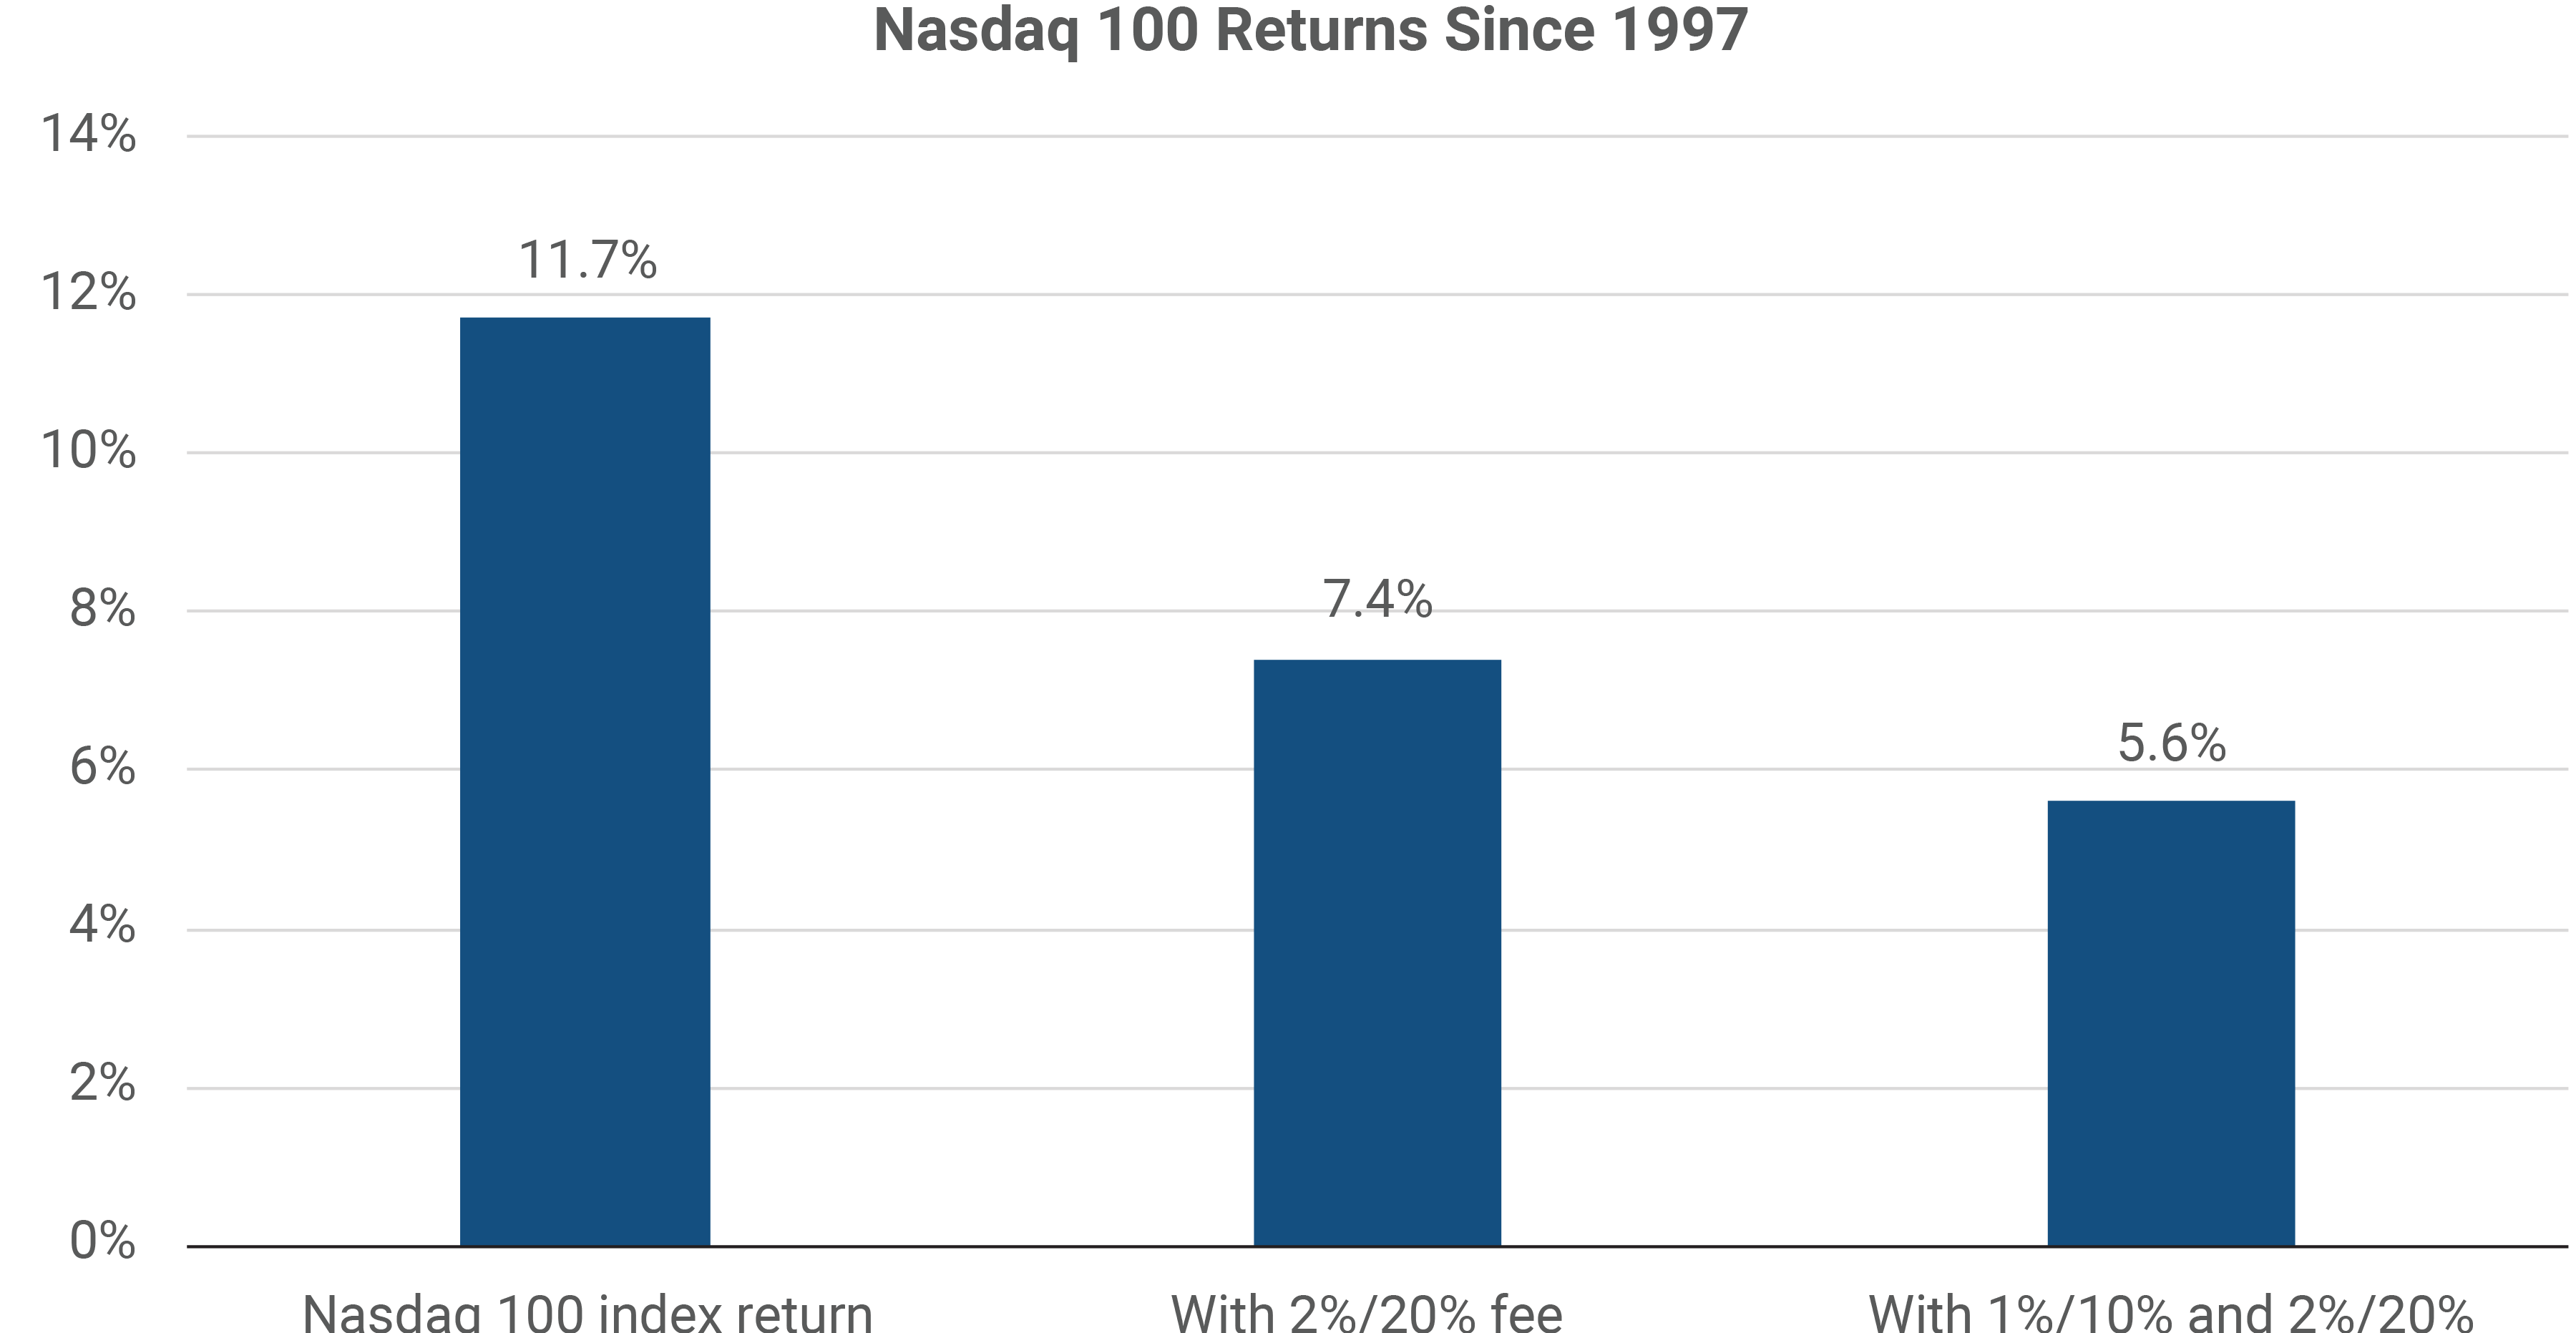
Often an individual investor in venture will invest via a “fund of funds” vehicle. Relative to selecting managers one at a time, a fund of funds can provide better diversification across managers and vintage years. The drawback is that the manager of the fund of funds will charge their own fees on top of the fees already being collected by the underlying venture managers. The fund of funds manager might charge as much as a 1% management fee and a 10% carried interest (performance fee). The chart illustrates how the return of the Nasdaq 100 since 1997 would have been impacted if 2%/20% fees were applied, and if both 1%/10% and 2%/20% were applied. An investor in the Nasdaq 100 who paid both layers of fees would have paid away more than half of their investment return in fees. The investment return impact of fees can be even worse if there are large gains (on which fees are collected) followed by large losses (on which fees are usually not refunded), as happened around the technology bubble.
Venture Capital Investment Timing is Pro-Cyclical
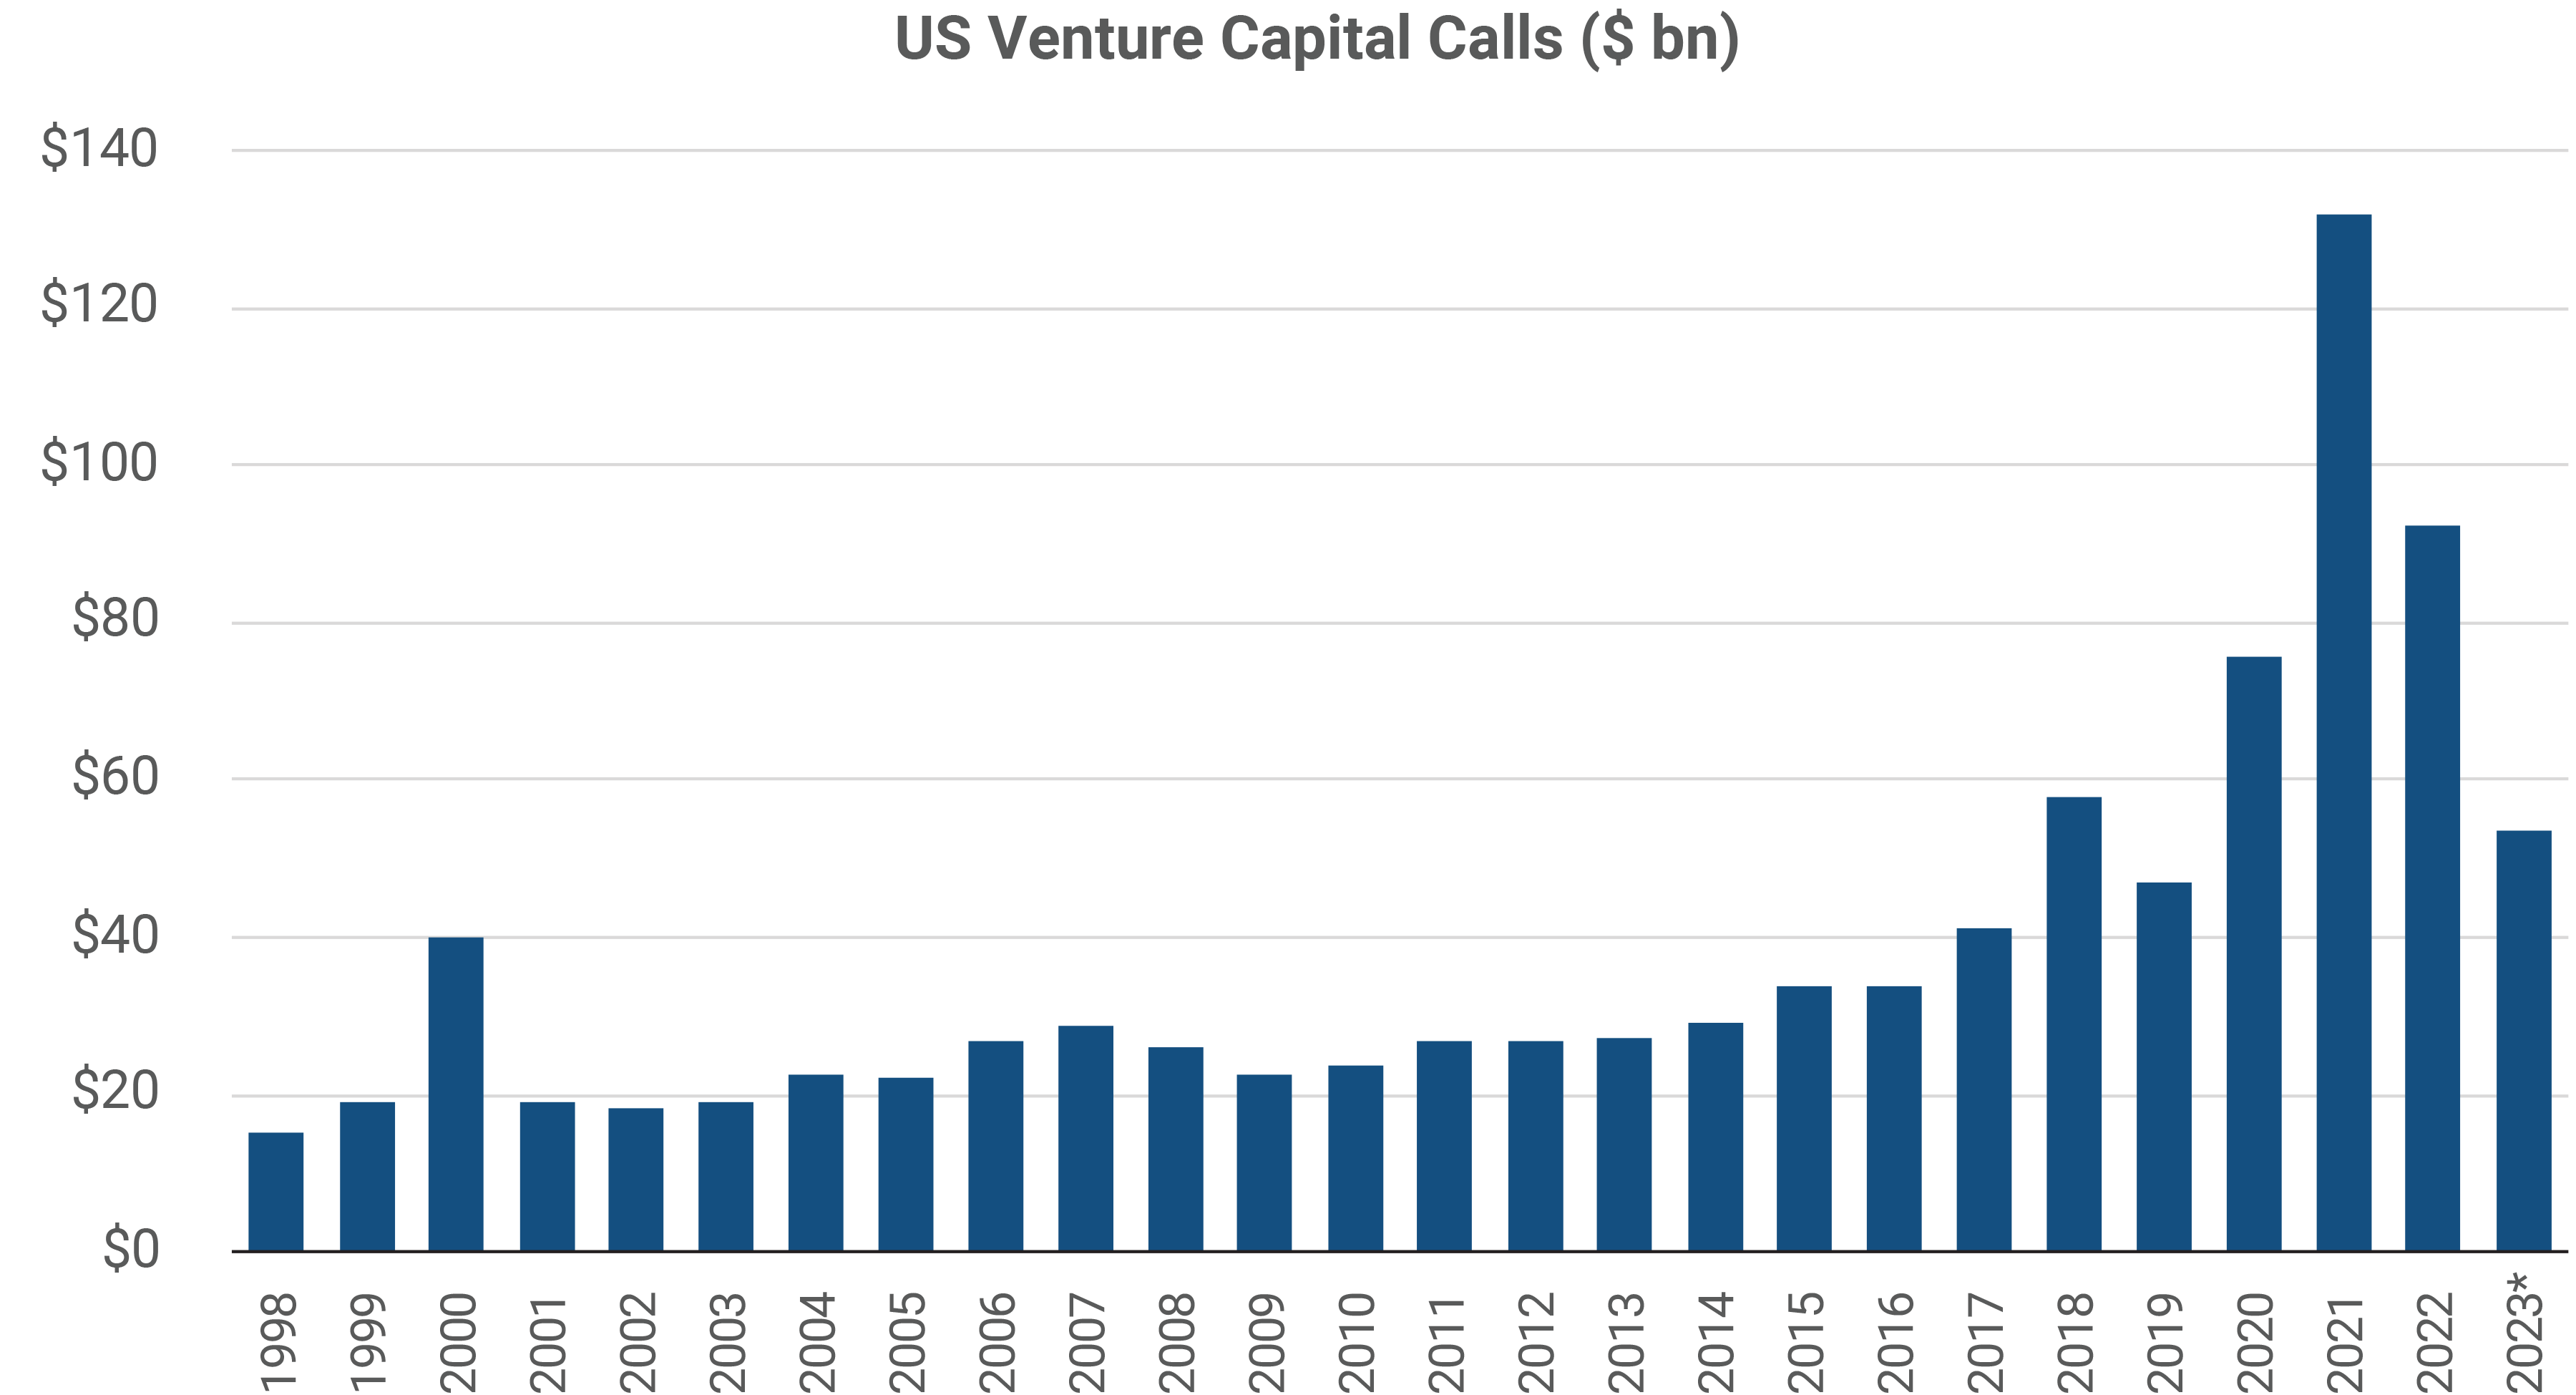
The investment outcomes of venture investors are skewed negatively because of the pro-cyclical nature of venture capital deployment. The venture industry swings from exuberant periods in which many competing companies receive capital at generous valuations (e.g., 1998 – 2000 and 2020 – 2021), to periods in which capital is hard to obtain.
The chart below shows the annual capital calls by US venture firms since 1998[4]. One can see the investment spikes in 2000 and 2021. Because venture firms tend to invest the most at the worst times, the average return on each dollar invested is lower than it would be if a steady amount were invested over time.
Venture Investors Face a Pileup at the Exit Window
There is an escalating mismatch between the money which has gone into venture and the money coming back out, which has become a source of strain for both venture firms and their investors.
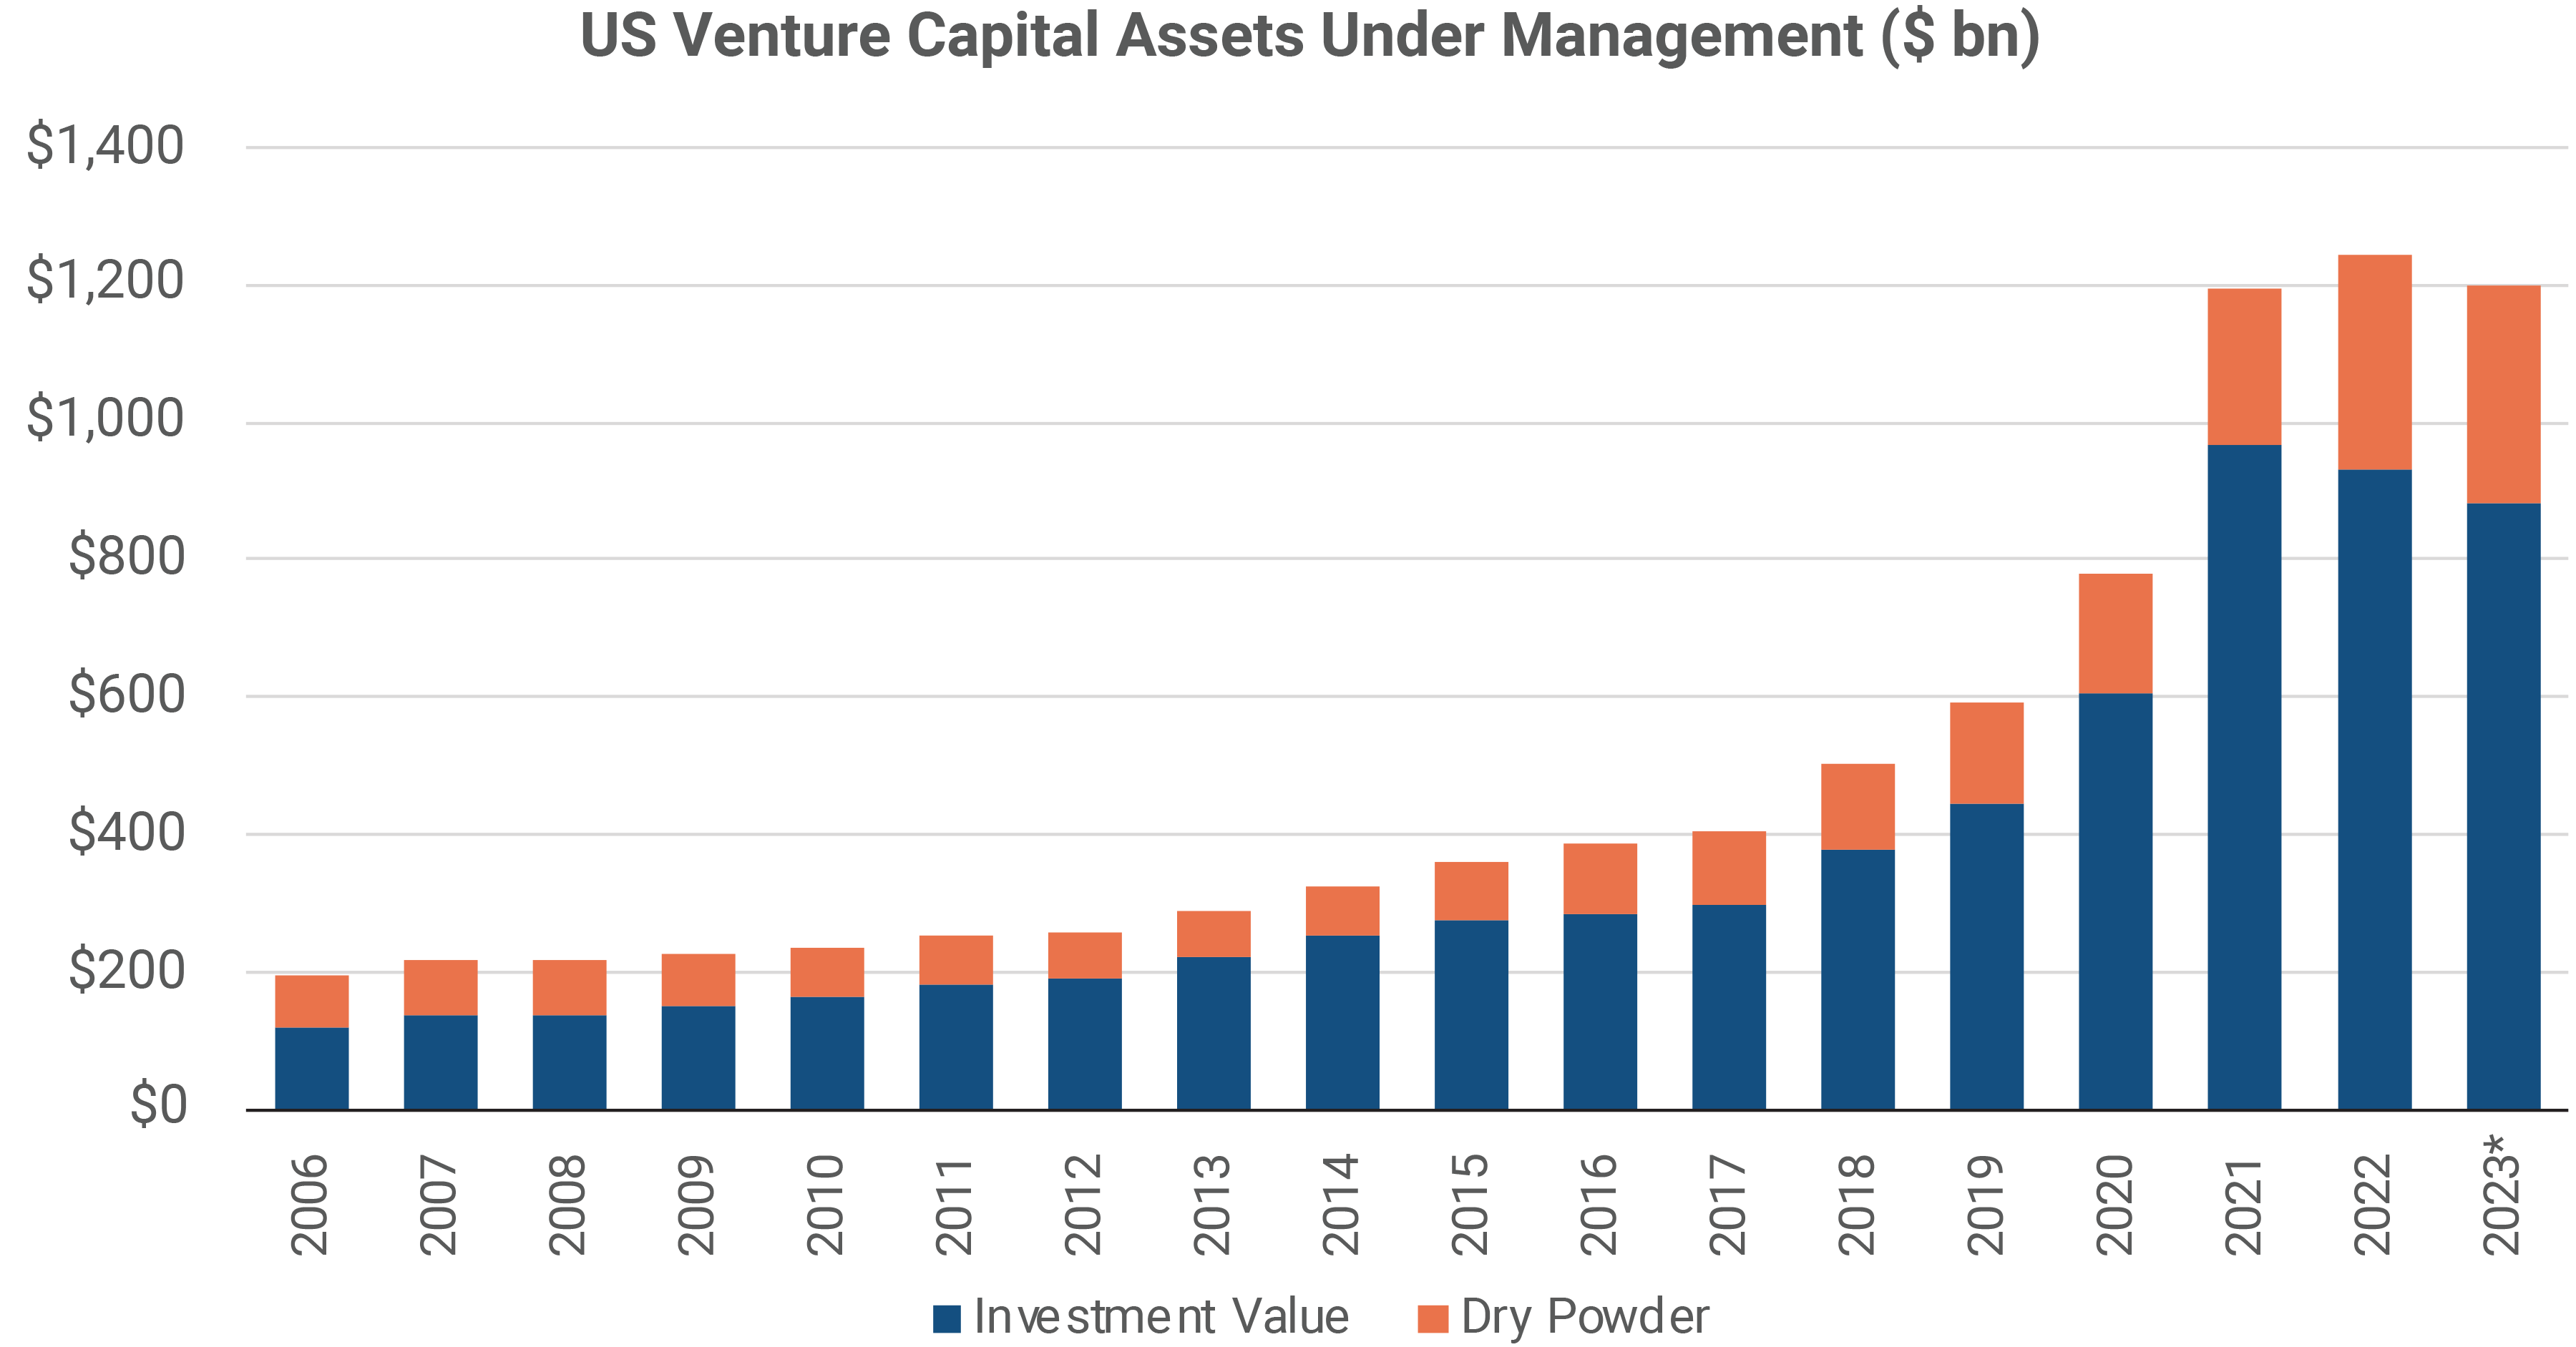
The chart below shows the growth of US venture capital assets[5]. Growth has been significant – the $1.2 trillion invested in venture at the end of 2023 is six times the amount which was invested in 2006. The $1.2 trillion includes $884 billion invested in start-up companies and another $317 million of “dry powder” – capital committed to venture which has not yet been deployed. Even with this rapid growth, venture remains a very small slice of the investment universe. The $884 billion invested by all the US venture firms is only about one-fourth of the value of Microsoft.
For each venture-backed company, the goal is to reach a successful “exit,” when the value built by the company is realized through an initial public offering (IPO) or a sale to a strategic or financial buyer, allowing capital to be distributed back to investors. The number of successful exits and value of distributions has shrunk meaningfully in the past two years.
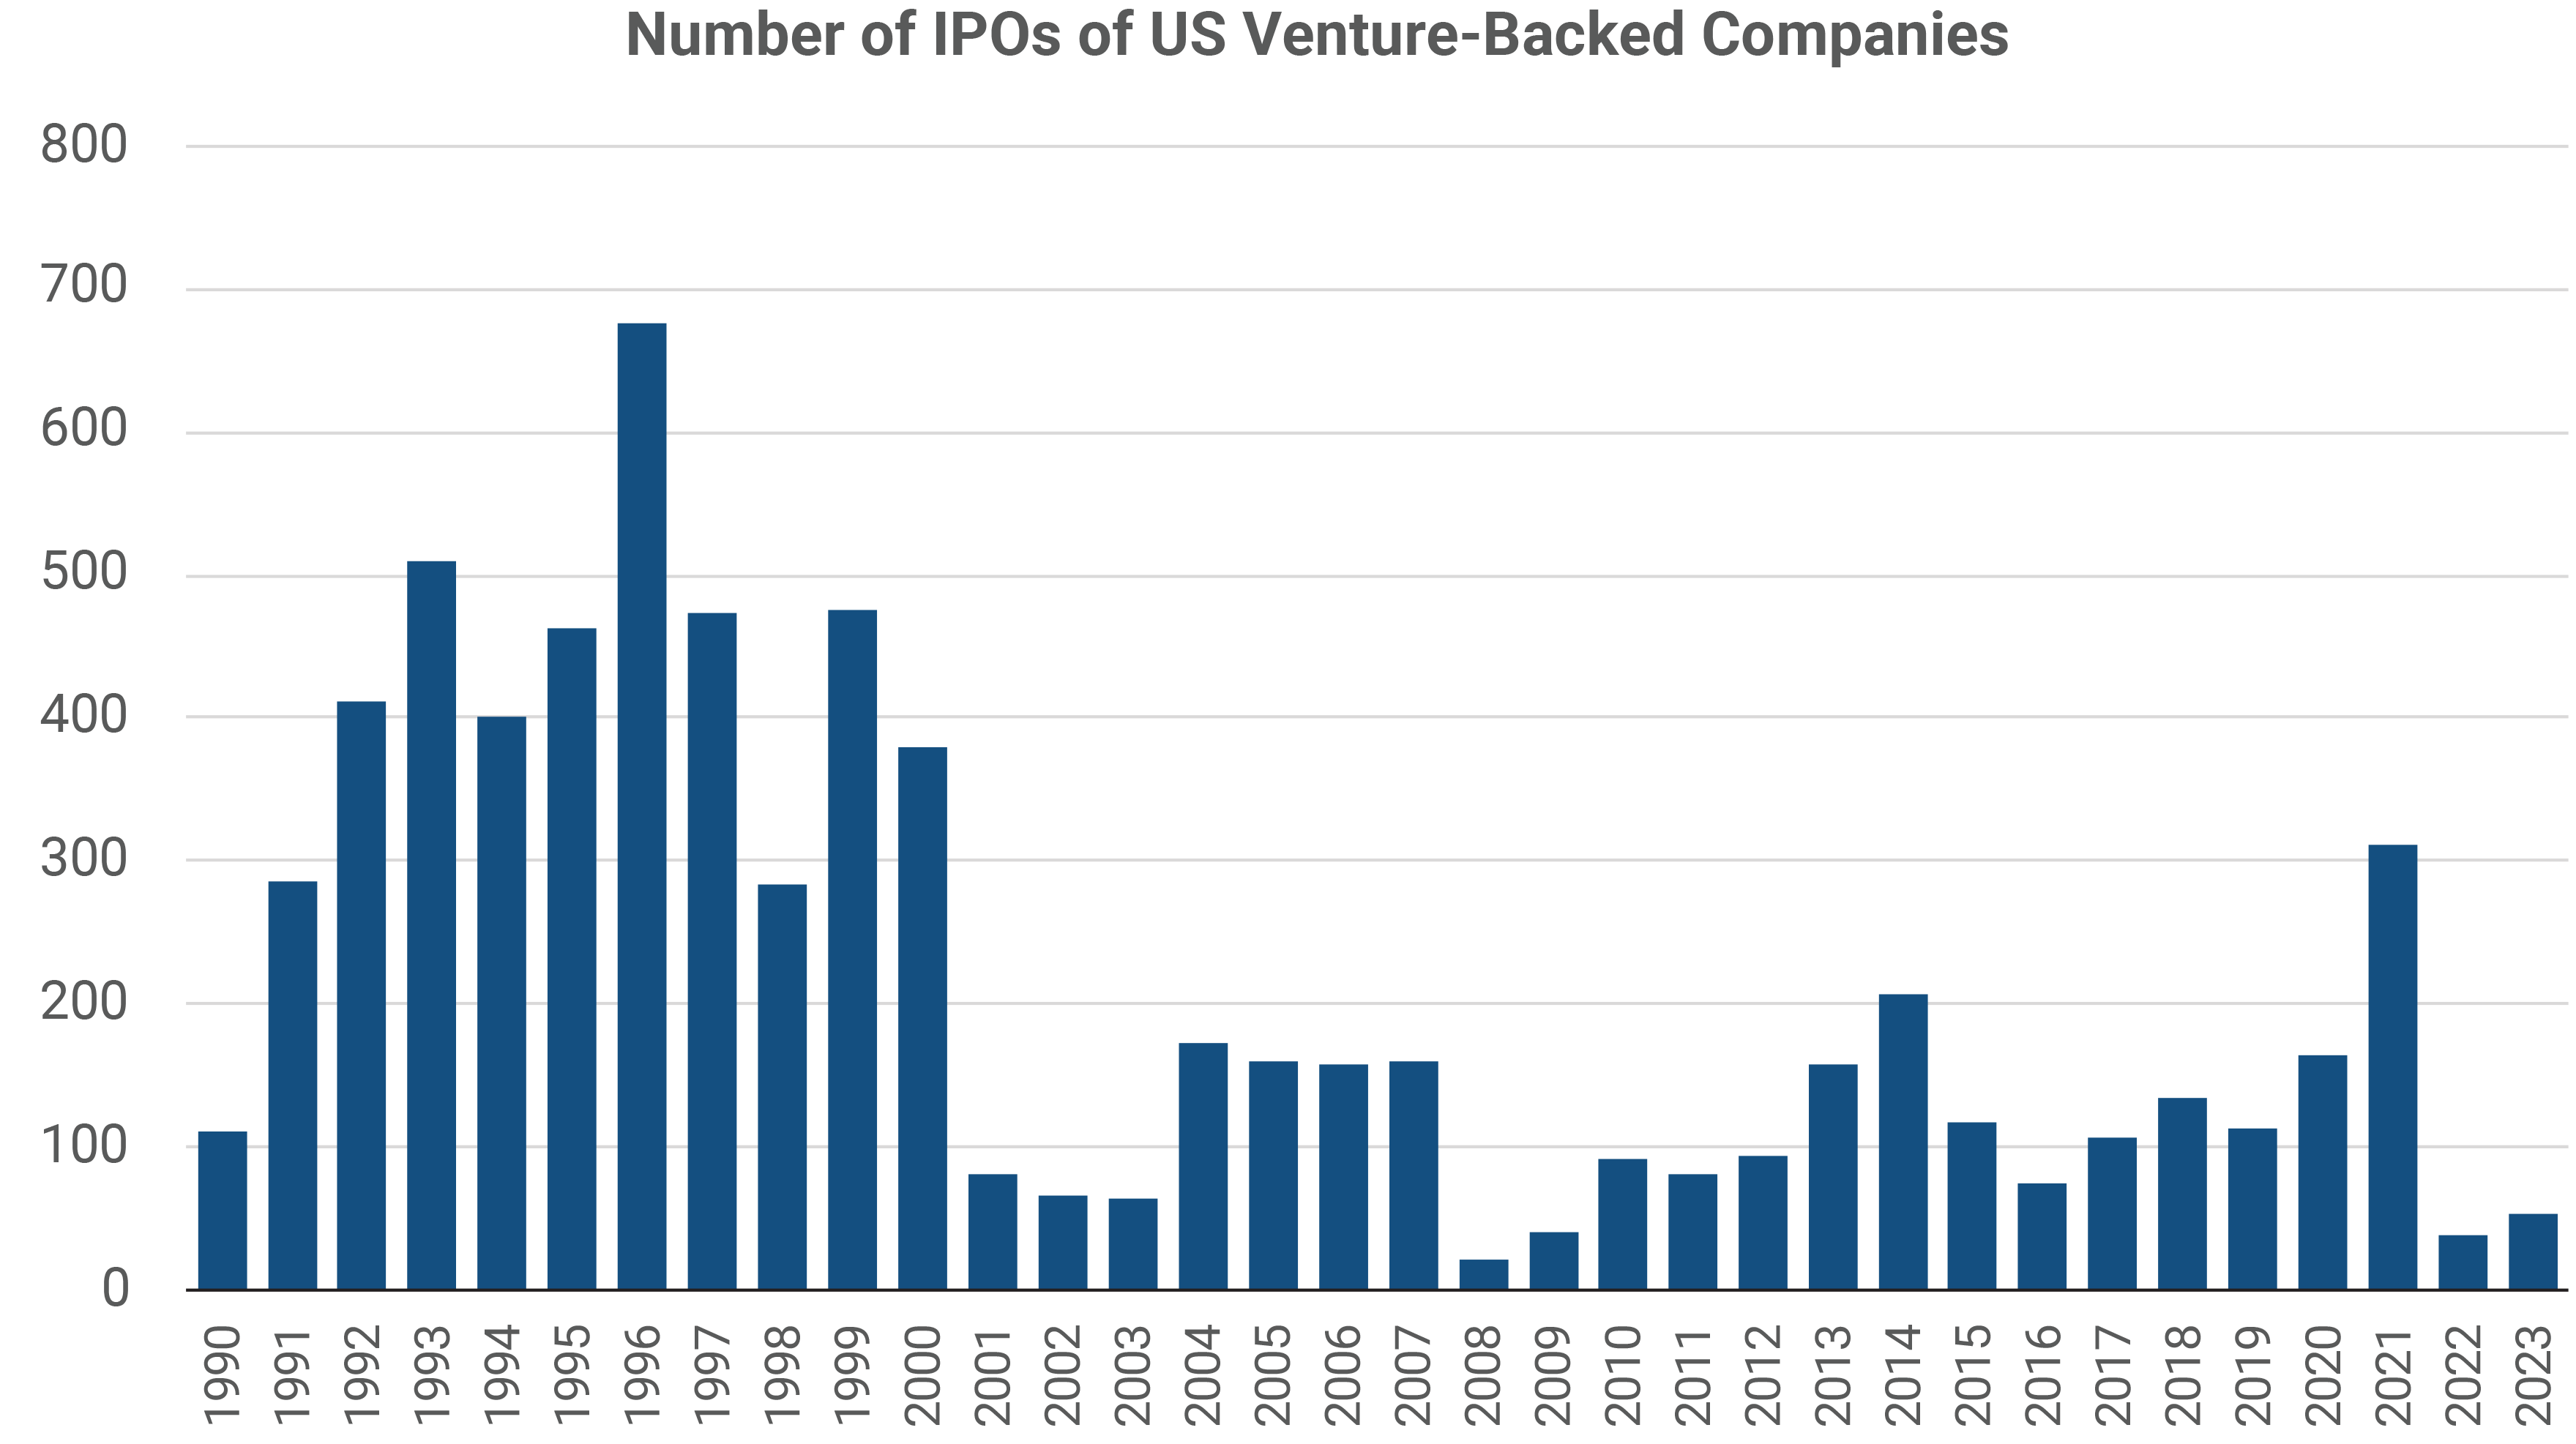
As the chart below indicates[6], IPO activity tends to be aligned with the stock market, with surges in the valuations of public technology stocks coinciding with surges in the number of IPOs. But the nice rebound in the prices of technology shares since late 2022 has not yet led to a corresponding rebound in IPOs of venture-backed companies. The 700 “unicorns” – venture investments with private valuations of $1 billion or more – continue to linger and (mostly) lose more money as they await an exit.
It is much more common for venture-backed companies to be sold to a strategic or financial buyer than to go public. But this type of exit has also been impaired, in part because the rise in interest rates has impacted financing costs. We can do the math – there are more than 50,000 venture-backed companies, and 1000 or more are added every quarter, yet there were only about 1000 exits of any kind in 2023.
In fact, the proportion of the value of US venture investments which was distributed back to investors fell below 6% in 2023, the lowest “distribution yield” since the Global Financial Crisis in 2009[7]. If exits are hard to obtain now, when the economy is strong and the valuations of public technology stocks are surging, what will become of the exit environment if conditions worsen? Sluggish distributions are leaving venture investors with less capital available for new commitments. As a result of these dynamics, venture fundraising has fallen sharply. Less than $10 billion was raised by US venture firms in Q1 2024, far off the pace of almost $50 billion per quarter in 2021 – 2022[8].
Hard to Access the Best Venture Firms
Among the thousands of venture capital firms, there is a small group which stands out above the rest for their pedigree, reputation and track record. Because the interest in investing with these elite venture firms is so great, they control which organizations are selected to be their investors. Often, the preferred investors are foundations and endowments. This makes it more difficult for individual investors (or fund of funds managers) to access the top tier of venture capital funds.
Who Should Invest in Venture Capital?
There is huge dispersion in outcomes from venture investing. According to a McKinsey report, the performance of the top quartile of venture funds over the past two decades exceeded the performance of the bottom quartile venture fund managers by more than 20% per year[9]. Investors who may benefit from investing in venture capital have experienced specialists in the investment team to identify the best ones in advance and must also be seen as desirable limited partners by the venture general partners they select.
Large, sophisticated institutional investors such as the large university endowment funds have had the means to participate successfully as venture investors. Such an investor will have direct access to the manager, visit the manager’s premises frequently, and spend many months undertaking an in-depth analysis of the people, investment strategy, prior performance, and business operations of a venture manager before making a choice to invest. If your venture manager selection process is done with this exceptional level of resources, access, and diligence, you might have reason to participate. Otherwise, there is a good chance of ending up with an average venture fund portfolio or worse, with the drawbacks discussed here.
Summary
David Swenson, the masterful Chief Investment Officer of the Yale University endowment once said: “in the absence of truly superior fund-selection skills (or extraordinary luck), investors should stay far, far away from private equity investments[10].” His view also applies to venture capital, a category of private equity. Individual investors have nothing like Yale’s experience, access, or resources for screening venture managers, and should not attempt to do so. Instead, Mr. Swenson argued that for individual investors the emphasis should be on well-constructed portfolios of liquid asset classes at the lowest possible implementation cost. We support this approach wholeheartedly. As discussed in this paper, the average outcomes obtained by venture investors are disappointing, and individuals are more likely to succeed as investors if they avoid the category altogether.
[1] See our recent commentary about hedge funds: https://atlasca.com/7-reasons-why-individual-investors-should-avoid-hedge-funds/
[2] Sources: Pitchbook, Cambridge Associates, Bloomberg.
[4] Source: Pitchbook-NVCA Venture Monitor Summary, 2023 results through September.
[5] Source: Pitchbook.
[6] Source: Initial Public Offerings: VC-backed IPO Statistics Through 2023, Jay R. Ritter, University of Florida.
[7] Source: Pitchbook-NVCA Venture Monitor Summary. Average distribution yield has been 18%.
[8] Source KPMG: https://assets.kpmg.com/content/dam/kpmg/xx/pdf/2024/04/venture-pulse-q1-2024.pdf
[9] Source: McKinsey Global Private Markets Review 2024.
[10] The Economist, “Bain or Blessing”, Jan 28, 2012.
Disclaimer
The information and opinions contained in this presentation are for background purposes only and do not purport to be full or complete. No reliance may be placed for any purpose on the information or opinions contained herein. Atlas does not give any representation, warranty or undertaking, or accept any liability, as to the accuracy or the completeness of the information or opinions contained herein. This presentation does not constitute an offer or solicitation to any person in any jurisdiction. Any such offering will only be made in accordance with the terms and conditions set forth in a private placement memorandum or other offering document. Recipients should not rely on this material in making any future investment decision. We do not represent that the information contained herein is accurate or complete, and it should not be relied upon as such. Opinions expressed herein are subject to change without notice. Certain information contained herein (including any forward-looking statements and economic and market information) has been obtained from published sources and/or prepared by third parties and in certain cases has not been updated through the date hereof. While such sources are believed to be reliable, Atlas and its affiliates do not assume any responsibility for the accuracy or completeness of such information. Atlas does not undertake any obligation to update the information contained herein as of any future date. Any views or opinions expressed may not reflect those of the firm as a whole. Any illustrative models or investments presented in this document are based on a number of assumptions and are presented only for the limited purpose of providing a sample illustration. Any hypothetical performance information contained herein does not represent the results of actual trading using client assets but were achieved by means of the retroactive application of a model. Any sample illustration is inherently subject to significant business, economic and competitive uncertainties and contingencies, many of which are beyond Atlas’s control. One of the limitations of hypothetical performance results is that they are prepared with the benefit of hindsight. In addition, hypothetical trading does not involve financial risk, and no hypothetical trading record can completely account for the impact of financial risk in actual trading. For example, the ability to withstand losses or adhere to a particular trading program in spite of trading losses are material points which can also adversely affect actual trading results. There are numerous other factors related to the markets in general or to the implementation of any specific trading program which cannot be fully accounted for in the preparation of hypothetical performance results and all of which can adversely affect actual trading results. This document may include projections or other forward-looking statements regarding future events, targets, intentions or expectations. Due to various risks and uncertainties, actual events or results may differ materially from those reflected or contemplated in such forward-looking statements. Past performance is no guarantee of future results. Investments are subject to risk, including the possible loss of principal. There is no guarantee that projected returns or risk assumptions will be realized or that an investment strategy will be successful. No representation, warranty or undertaking is made as to the reasonableness of the assumptions made herein or that all assumptions made herein have been stated. Different types of investments involve varying degrees of risk, and there can be no assurance that the future performance of any specific investment, investment strategy, or product made reference to directly or indirectly in this document, will be profitable, equal any corresponding indicated performance level(s), or be suitable for your portfolio. The information contained in this document is based on matters as they exist as of the date of preparation of such material and not as of the date of distribution or any future date and Atlas does not undertake any obligation to update the information contained herein as of any future date. This document does not constitute advice or a recommendation or offer to sell or a solicitation to deal in any security or financial product. It is provided for background purposes only and on the understanding that the recipient has sufficient knowledge and experience to be able to understand and make its own evaluation of the information described herein, any risks associated therewith and any related legal, tax, accounting or other material considerations. To the extent that a reader has any questions regarding the applicability of any specific issue discussed above to his/her/its specific portfolio or situation, it is encouraged to consult with the professional advisor of his/her/its choosing. Investment advisory and management services are provided by Atlas Capital Advisors, Inc. Atlas is registered as an investment advisor with the Securities and Exchange Commission.


