What’s Discussed
- The Federal Reserve has taken the Fed Funds rate from just over zero in March 2022 to 5.25% – 5.50% by the end of July 2023.
- Three things which stand out about this tightening episode are: the extreme looseness of monetary policy when it started, the slow realization by investors of how much tightening would be required, and the predicted recession, which did not yet happen.
- While the US economy has escaped recession so far, there remains latent potential for the large increase in interest rates to depress economic activity.
- In past tightening cycles, the most detrimental impact on the US economy tended to begin about a year and a half after the first increase in rates, where we are now.
History of tightening cycles
There have been sixteen tightening episodes in the past 70 years, shaded in the chart below. The median tightening cycle lasted 14 months, during which the Fed Funds rate rose by 3.5%. This tightening cycle is at its 18th month with an increase of 5.25% in the Fed Funds rate so far.
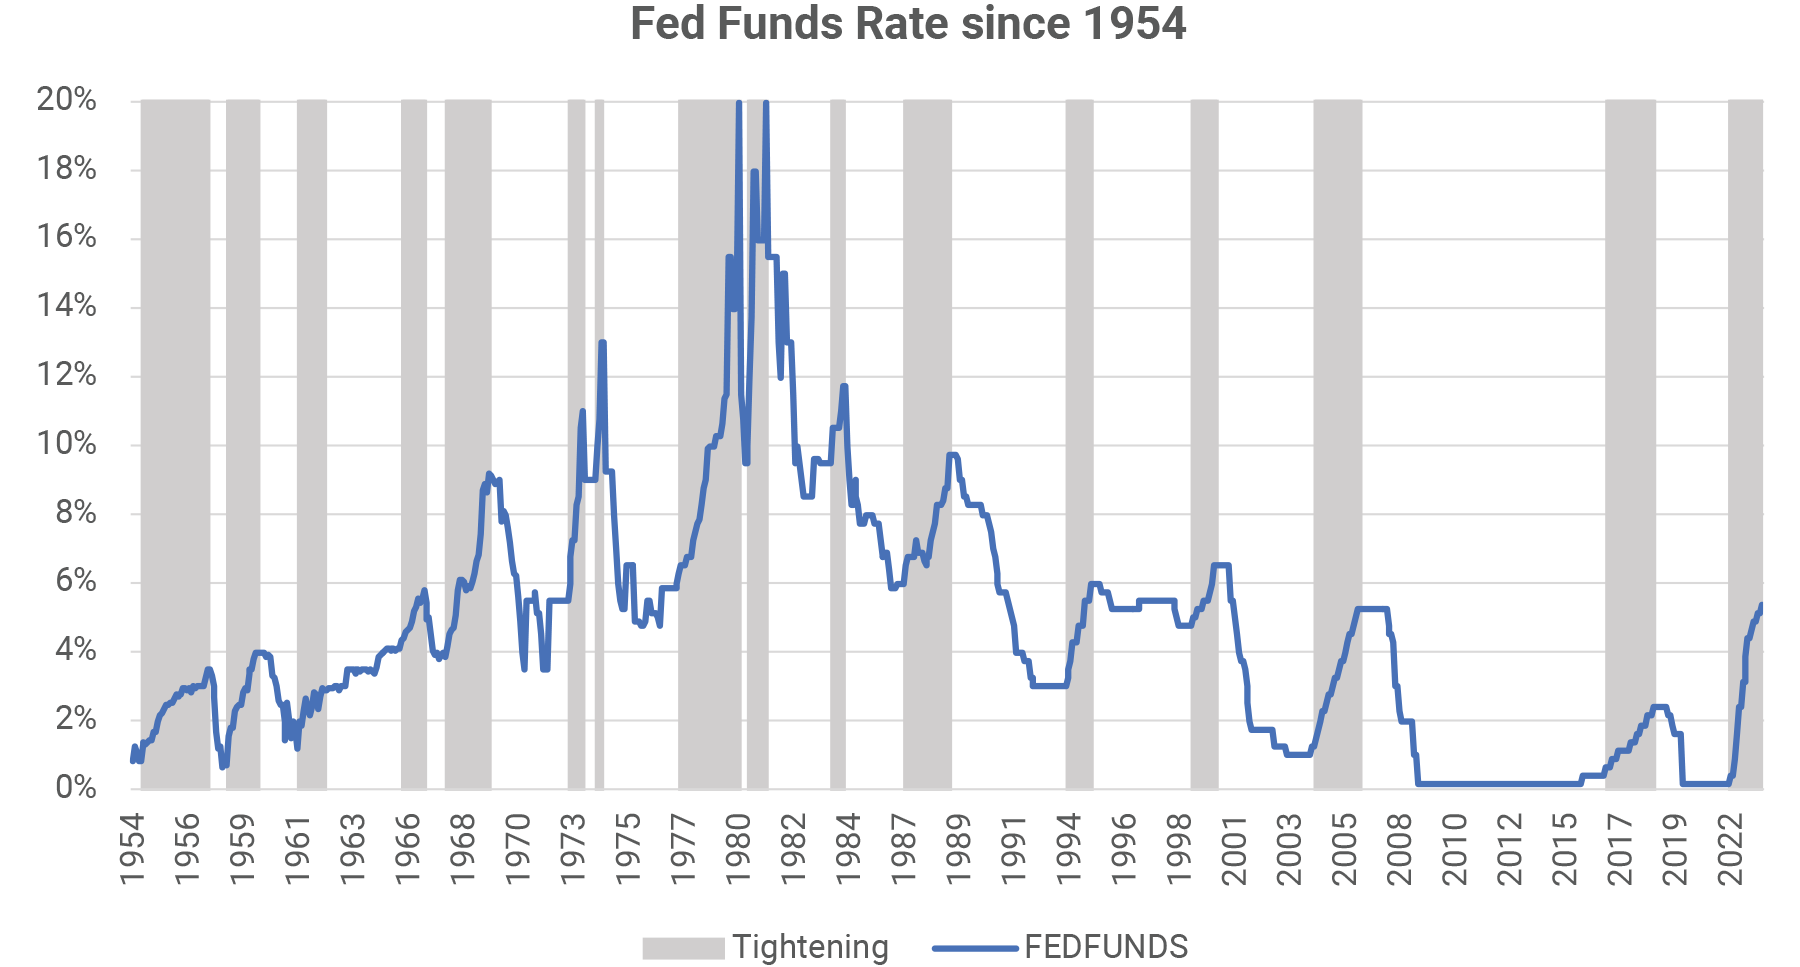
Fed tightening has led to poor investment returns, on average, especially for fixed income investors. During tightening periods, the return on US ten-year treasury bonds has been 7% per year less than the return on cash, while S&P 500 investors earned 1%/year over cash. The current episode has been much worse than usual for ten-year treasury investors (13%/year below cash), and about the same for equity investors, who after steep losses have recovered all the way back to cash plus 1.5%/year. In the blank periods on the chart when Fed was not tightening, ten-year bonds earned 6% over cash while equity investors earned 8% over cash.
A compelling need for tightening
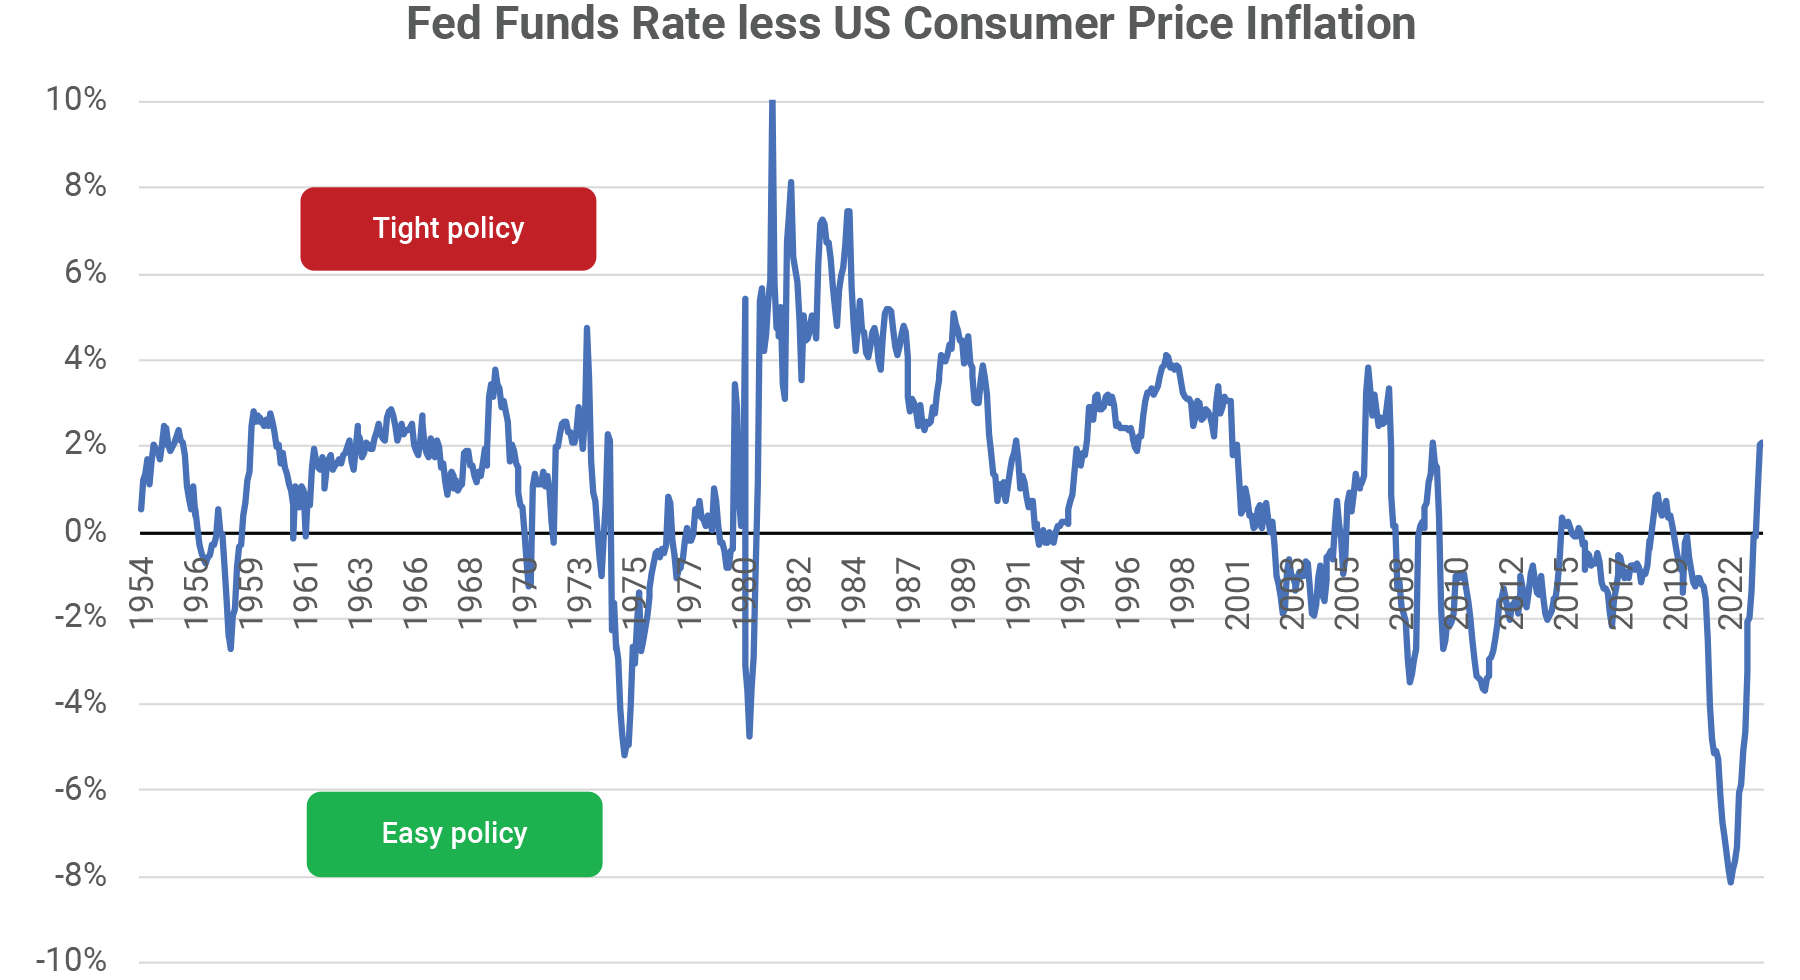
The next chart shows the relationship between the Fed Funds rate and inflation. There was a clear shift in Fed policy after the Global Financial Crisis of 2008 – 2009. From 1954 to 2007 the Fed Funds rate averaged 1.8% above inflation. Since 2007, the Fed Funds rate has averaged 1.6% below inflation. When this tightening cycle began in March 2022, the gap between the Fed Funds rate and inflation was the highest it had ever been. Compounding the looseness of monetary policy, central banks had also created $11 trillion in global liquidity in 2020 – 2021 through quantitative easing. At the start of last year, there was a very long way for the Fed to go to get back to a more neutral monetary policy.
Yet not much tightening was expected
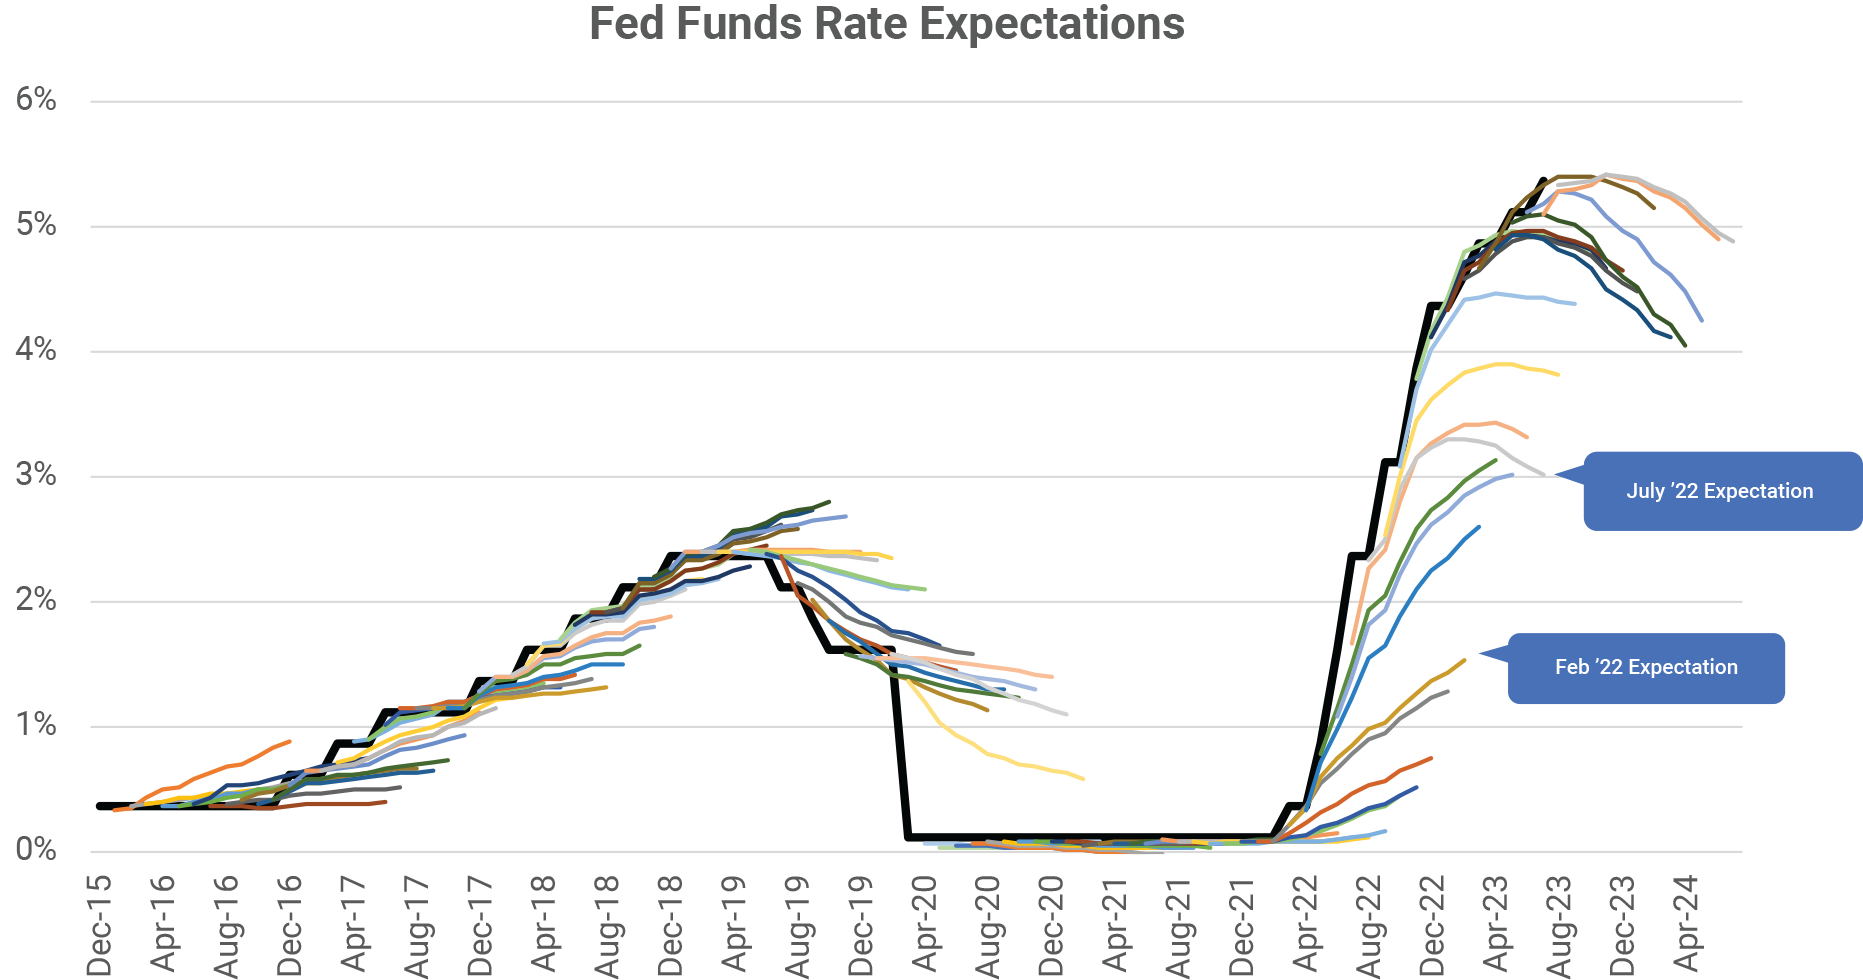
Even though monetary policy in March 2022 was far too easy for the current situation, fixed income investors clung to the belief that not much tightening would be required. We call the chart below a “hair chart.” In the chart, the Fed Funds rate is the solid black line. On each date there is a “hair” showing the expected Fed Funds rate for the following twelve months, based on Fed Funds futures contracts. For instance, there is a light grey hair showing the rates which were expected in July 2022 for August 2022 through July 2023. In July 2022, investors expected Fed Funds to peak at 3.3% around December 2022 and be back down to 3.0% by July 2023. In fact, Fed Funds reached 5.4% in July 2023. Each hair from July 2022 onwards has a downward curve in it, indicating an expectation that the Fed would “pivot” to lower rates within the next twelve months.
In the latest Federal Open Market Committee meeting on July 26, the Fed reiterated that there is still work to do to reach the target inflation rate of 2%. While headline inflation has fallen back to 3%, “core” inflation, which leaves out food and energy, is still at 4.8% year over year and the Fed’s preferred inflation measure, the Personal Consumption Expenditures Price Index, is at 4.1%. While the Fed is leaving open the possibility of additional tightening, one can see from the hair chart that bond investors believe they are done raising rates. Will they be wrong again?
Fed tightening often leads to a recession
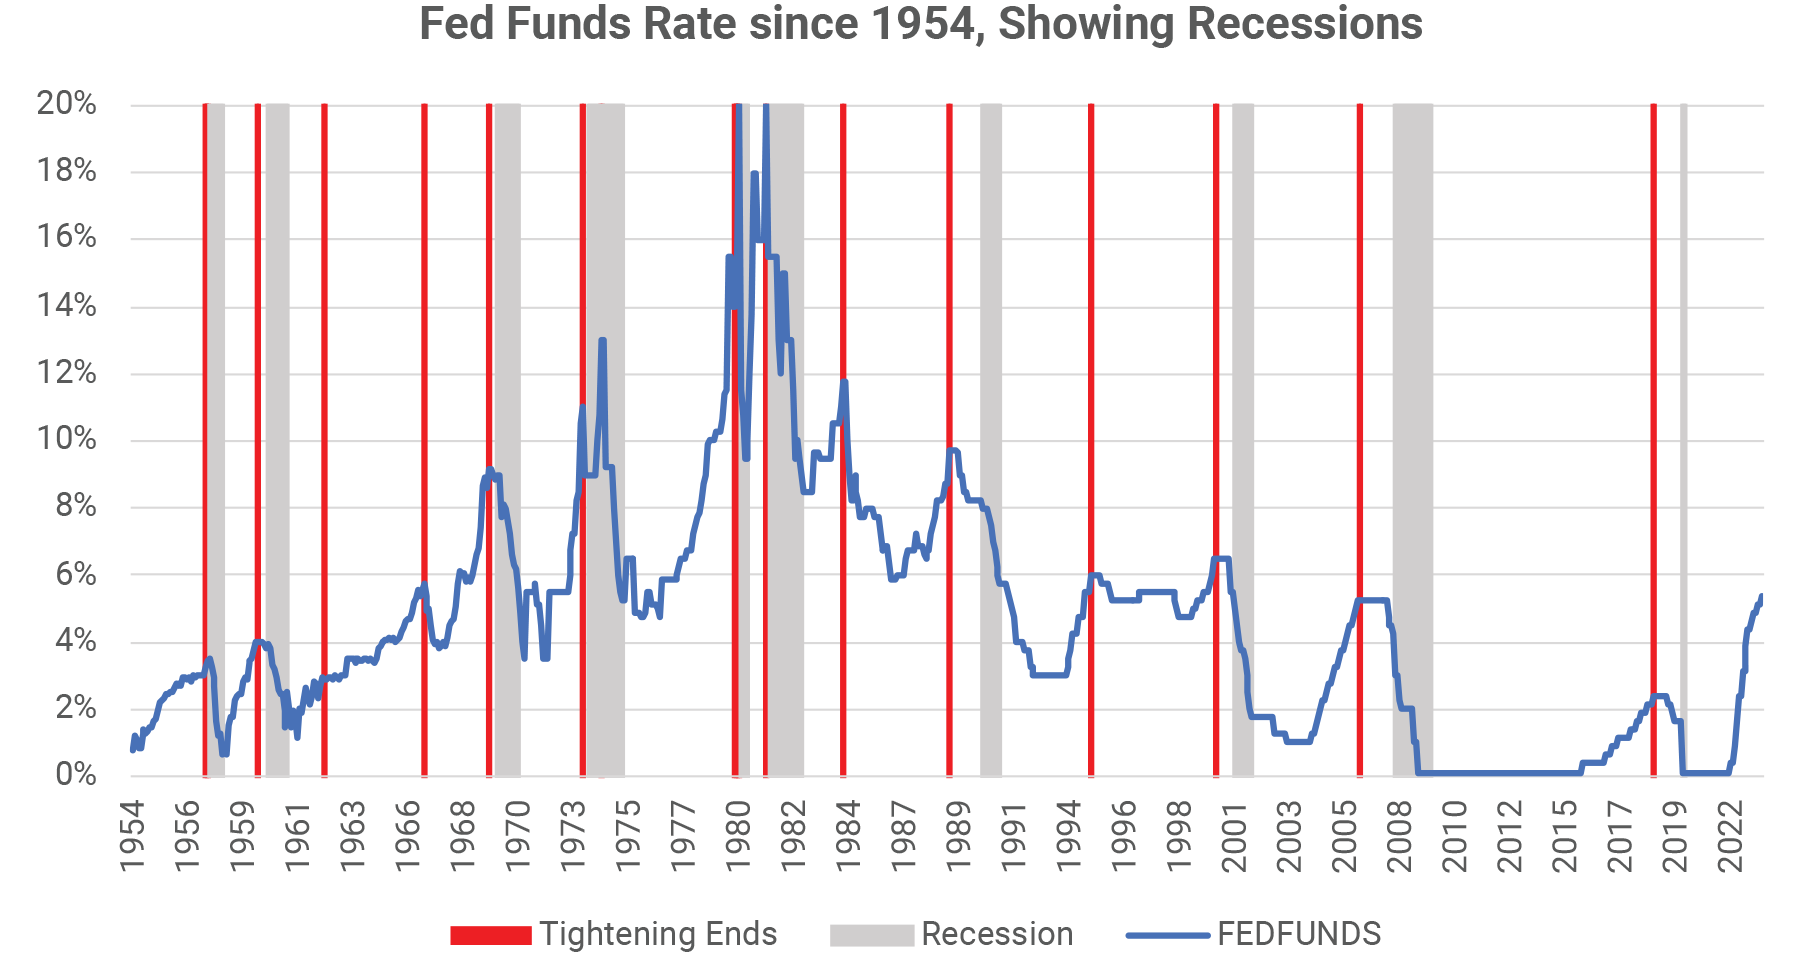
As the chart below indicates, the US recessions of the last 70 years occurred after interest rate increases. In each instance that the Fed raised rates by more than 5% (1969, 1973, 1979, 1981) a recession followed shortly thereafter. Once the Fed began tightening last year, a recession seemed likely. Seventy-two percent of economists surveyed in August 2022 expected the US would be in a recession by mid-2023. This was the only time in our careers in which most economists predicted a recession – the prior recessions occurred without there being a majority view they would happen.
No recession so far
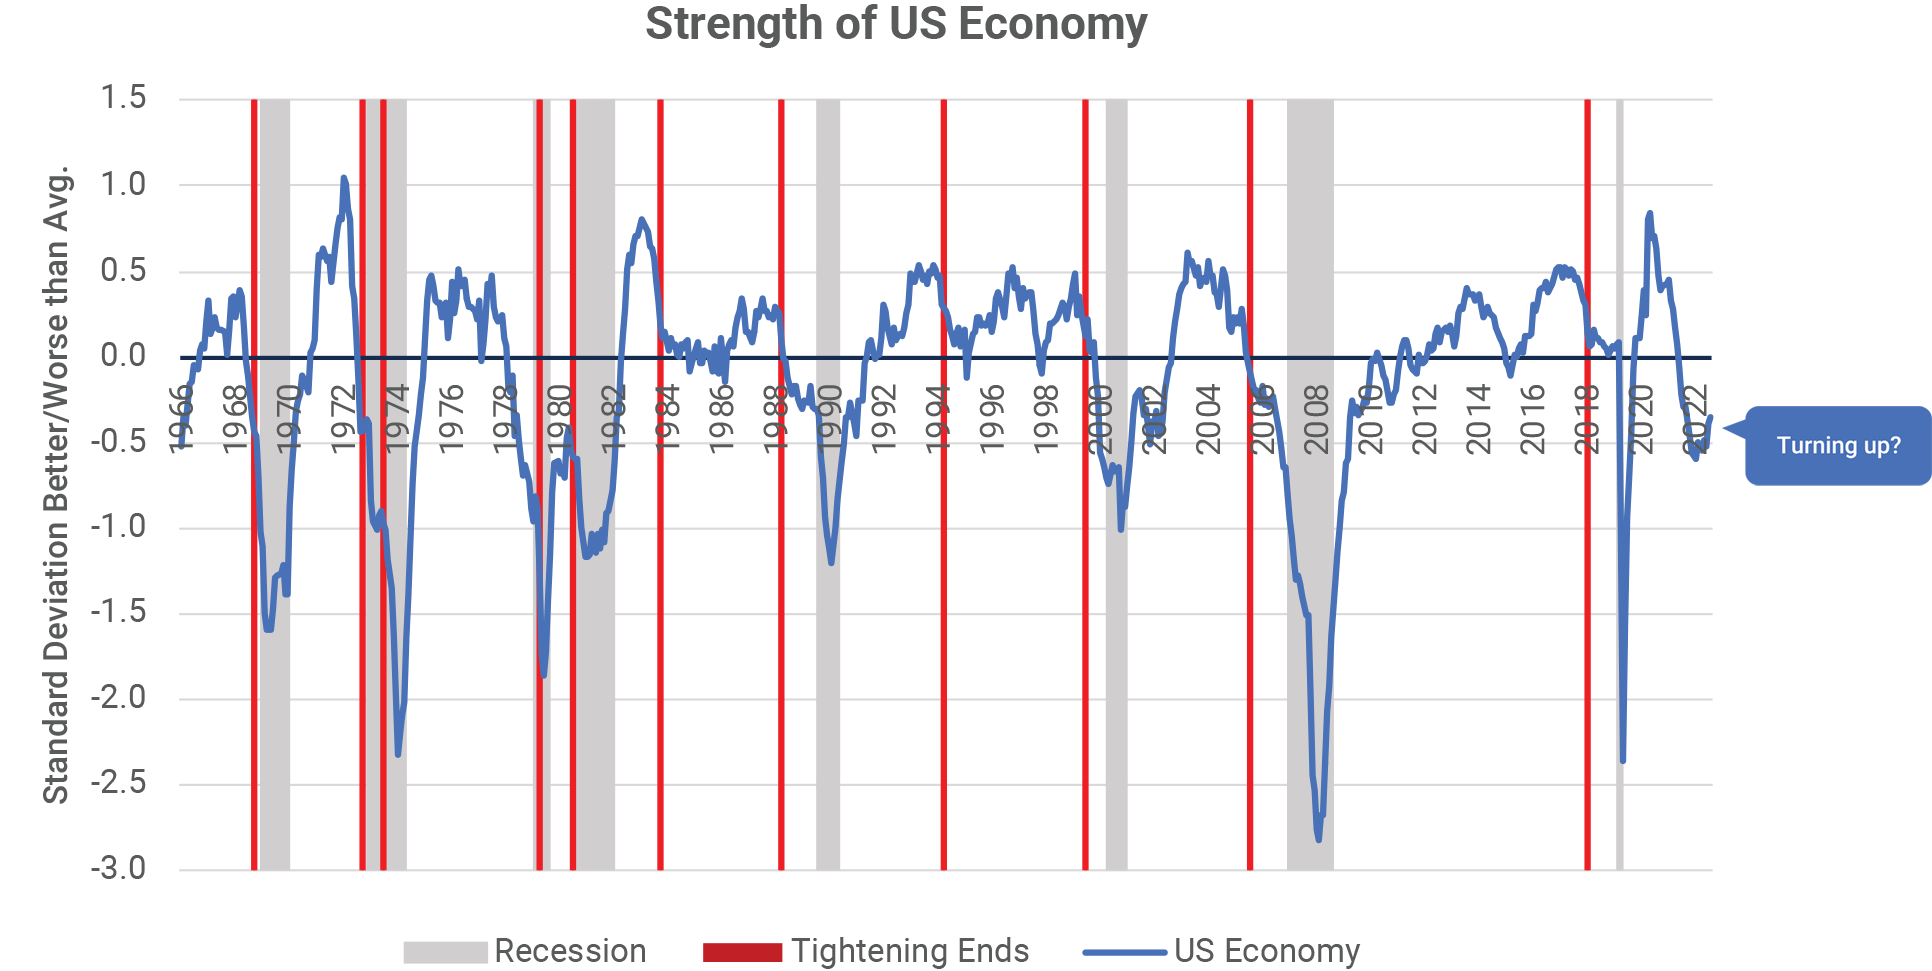
The blue line on the following chart shows the strength of the US economy, based on a composite of the economic data. Positive values on the chart indicate the US economy overall is doing better than historical norms. This composite became negative in May 2022, a couple of months after the Fed began tightening, and continued to fall through December 2022. Yet this year the trajectory changed for the better. Employment has been strong throughout, with the US unemployment rate reaching a record low of 3.4% in April, and still at 3.5% in the most recent report. The stability of the US economy has dented the confidence of recession forecasters, causing some to change their view.
But the economy is not yet in the clear
Monetary policy operates with a lag – it can take over a year for the impact of higher interest rates to affect the economy. In the past, the more severe economic impact happened after the tightening ended rather than during the tightening episode. For instance, on average historically the US unemployment rate did not change while the Fed was tightening, but it went up nearly 2% in the 18 months following the last rate hike.
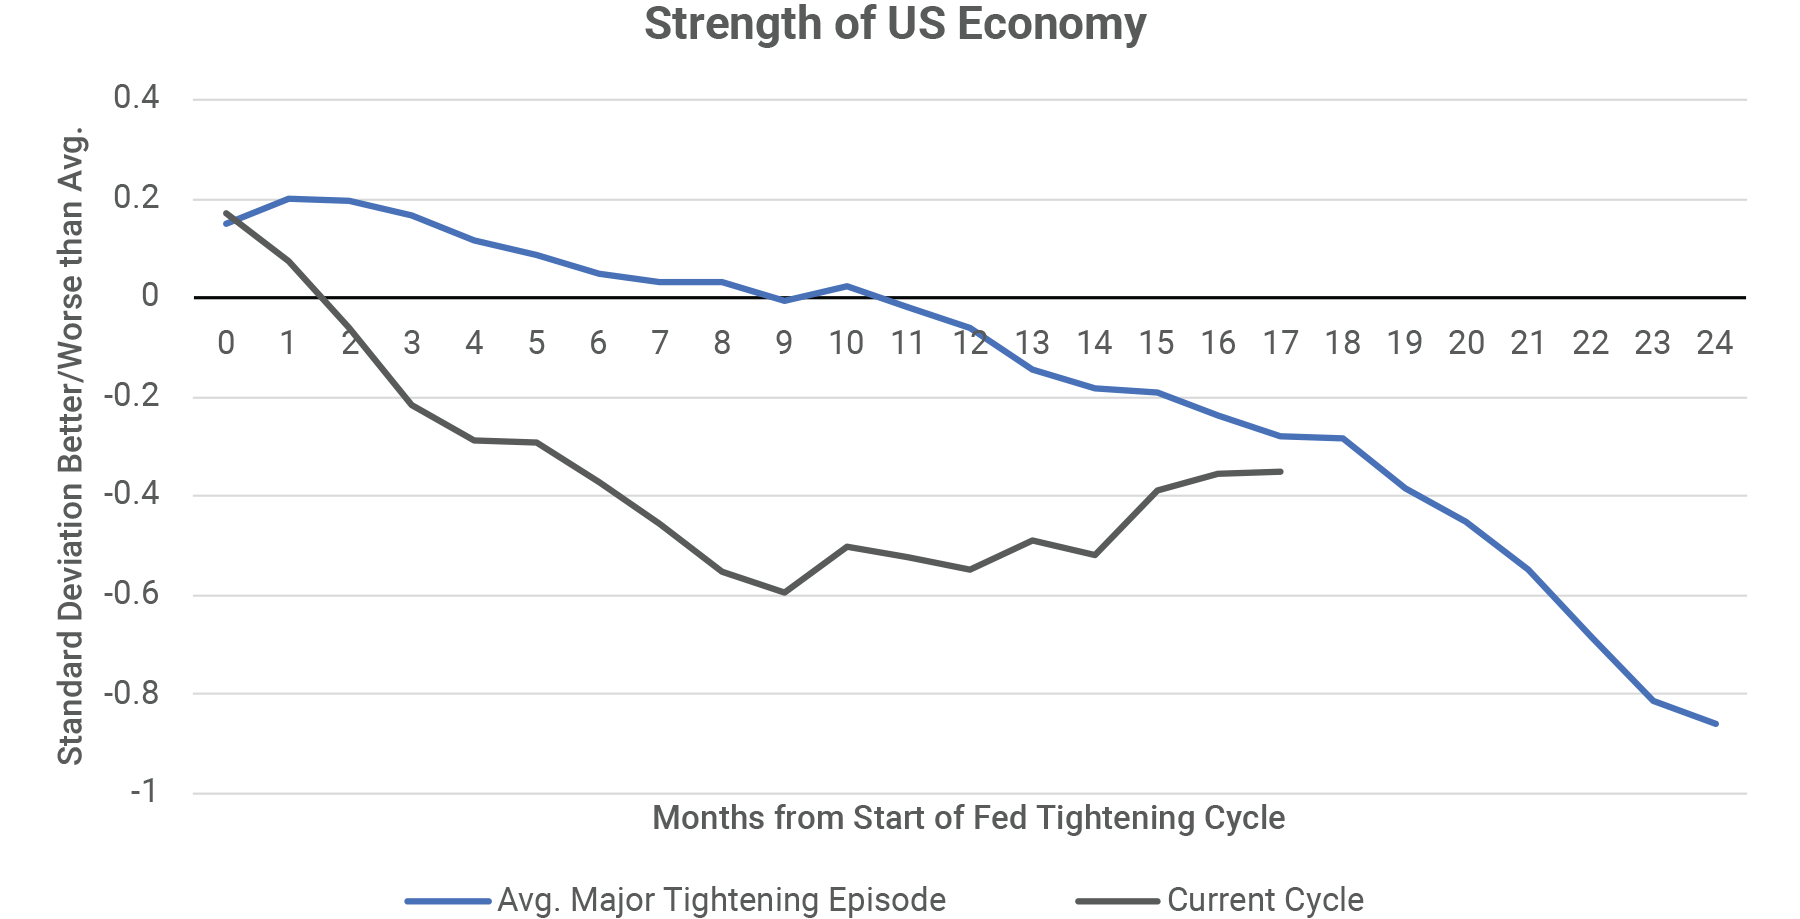
In the chart below, we show in blue how the health of the US economy changed, on average, during the larger/longer Fed rate hikes of the past 60 years. We can see that in those cases the slope of the decline became more negative 18 months from the start of Fed tightening. We can also see (in black) that in the current tightening cycle the economy descended more quickly at first but has recovered back to a similar position as in the prior episodes. In the past, every time this economic strength metric fell to -0.5 or lower, the US had a recession. The metric edged below -0.5 in December 2022 yet climbed back to -0.35 by the end of July 2023. If the US is to avoid a recession, the next six months are critical.
Summary
The current cycle of interest rate hikes stands out for how much it was needed, how slow bond investors were to realize how much tightening was required and for the unrealized expectation of a recession. The resilience of the US economy this year has enabled the Fed to keep inflation as its top priority and continue increasing rates more than bond investors expected. The Fed is likely pleased to have engineered a significant decline in inflation without yet tripping the economy over into a recession. But it is too early to declare victory – in past tightening cycles the more detrimental economic impacts began 18 months from the initial rate hike.


What’s Discussed
History of tightening cycles
There have been sixteen tightening episodes in the past 70 years, shaded in the chart below. The median tightening cycle lasted 14 months, during which the Fed Funds rate rose by 3.5%. This tightening cycle is at its 18th month with an increase of 5.25% in the Fed Funds rate so far.
Fed tightening has led to poor investment returns, on average, especially for fixed income investors. During tightening periods, the return on US ten-year treasury bonds has been 7% per year less than the return on cash, while S&P 500 investors earned 1%/year over cash. The current episode has been much worse than usual for ten-year treasury investors (13%/year below cash), and about the same for equity investors, who after steep losses have recovered all the way back to cash plus 1.5%/year. In the blank periods on the chart when Fed was not tightening, ten-year bonds earned 6% over cash while equity investors earned 8% over cash.
A compelling need for tightening
The next chart shows the relationship between the Fed Funds rate and inflation. There was a clear shift in Fed policy after the Global Financial Crisis of 2008 – 2009. From 1954 to 2007 the Fed Funds rate averaged 1.8% above inflation. Since 2007, the Fed Funds rate has averaged 1.6% below inflation. When this tightening cycle began in March 2022, the gap between the Fed Funds rate and inflation was the highest it had ever been. Compounding the looseness of monetary policy, central banks had also created $11 trillion in global liquidity in 2020 – 2021 through quantitative easing. At the start of last year, there was a very long way for the Fed to go to get back to a more neutral monetary policy.
Yet not much tightening was expected
Even though monetary policy in March 2022 was far too easy for the current situation, fixed income investors clung to the belief that not much tightening would be required. We call the chart below a “hair chart.” In the chart, the Fed Funds rate is the solid black line. On each date there is a “hair” showing the expected Fed Funds rate for the following twelve months, based on Fed Funds futures contracts. For instance, there is a light grey hair showing the rates which were expected in July 2022 for August 2022 through July 2023. In July 2022, investors expected Fed Funds to peak at 3.3% around December 2022 and be back down to 3.0% by July 2023. In fact, Fed Funds reached 5.4% in July 2023. Each hair from July 2022 onwards has a downward curve in it, indicating an expectation that the Fed would “pivot” to lower rates within the next twelve months.
In the latest Federal Open Market Committee meeting on July 26, the Fed reiterated that there is still work to do to reach the target inflation rate of 2%. While headline inflation has fallen back to 3%, “core” inflation, which leaves out food and energy, is still at 4.8% year over year and the Fed’s preferred inflation measure, the Personal Consumption Expenditures Price Index, is at 4.1%. While the Fed is leaving open the possibility of additional tightening, one can see from the hair chart that bond investors believe they are done raising rates. Will they be wrong again?
Fed tightening often leads to a recession
As the chart below indicates, the US recessions of the last 70 years occurred after interest rate increases. In each instance that the Fed raised rates by more than 5% (1969, 1973, 1979, 1981) a recession followed shortly thereafter. Once the Fed began tightening last year, a recession seemed likely. Seventy-two percent of economists surveyed in August 2022 expected the US would be in a recession by mid-2023. This was the only time in our careers in which most economists predicted a recession – the prior recessions occurred without there being a majority view they would happen.
No recession so far
The blue line on the following chart shows the strength of the US economy, based on a composite of the economic data. Positive values on the chart indicate the US economy overall is doing better than historical norms. This composite became negative in May 2022, a couple of months after the Fed began tightening, and continued to fall through December 2022. Yet this year the trajectory changed for the better. Employment has been strong throughout, with the US unemployment rate reaching a record low of 3.4% in April, and still at 3.5% in the most recent report. The stability of the US economy has dented the confidence of recession forecasters, causing some to change their view.
But the economy is not yet in the clear
Monetary policy operates with a lag – it can take over a year for the impact of higher interest rates to affect the economy. In the past, the more severe economic impact happened after the tightening ended rather than during the tightening episode. For instance, on average historically the US unemployment rate did not change while the Fed was tightening, but it went up nearly 2% in the 18 months following the last rate hike.
In the chart below, we show in blue how the health of the US economy changed, on average, during the larger/longer Fed rate hikes of the past 60 years. We can see that in those cases the slope of the decline became more negative 18 months from the start of Fed tightening. We can also see (in black) that in the current tightening cycle the economy descended more quickly at first but has recovered back to a similar position as in the prior episodes. In the past, every time this economic strength metric fell to -0.5 or lower, the US had a recession. The metric edged below -0.5 in December 2022 yet climbed back to -0.35 by the end of July 2023. If the US is to avoid a recession, the next six months are critical.
Summary
The current cycle of interest rate hikes stands out for how much it was needed, how slow bond investors were to realize how much tightening was required and for the unrealized expectation of a recession. The resilience of the US economy this year has enabled the Fed to keep inflation as its top priority and continue increasing rates more than bond investors expected. The Fed is likely pleased to have engineered a significant decline in inflation without yet tripping the economy over into a recession. But it is too early to declare victory – in past tightening cycles the more detrimental economic impacts began 18 months from the initial rate hike.
Share to Social Media!
Subscribe To Receive The Latest News
Related Posts
What are credit spreads telling us about the U.S. stock market?
October 2024 Recap
September 2024 Recap
August 2024 Recap