What’s Discussed:
- Extensive academic research, pioneered by Nobel laureates Eugene Fama and Ken French, demonstrates that measurable factors such as value and momentum influence the future returns of stocks
- These factors have had a more pronounced impact in January than in any other month
- Moreover, the impact in January can be opposite to the impact in other months
- In general, the stocks which have had the best returns in January are those which have low prior returns, favorable value metrics, and high volatility
- This “January effect” is attributed to tax-loss selling and window-dressing in December as well as an increase in risk appetite in January
- Investors who apply these dynamics would have enjoyed favorable outcomes in January 2023 and would reduce holdings in last year’s winners for January 2024
The calculations herein are based on the online data posted by Nobel laureates Eugene Fama and Ken French.[1] Fama and French are best known for their pioneering research identifying how factors such as value and momentum influence stock price outcomes. In the Fama-French methodology, US stocks are sorted into deciles each month based on an attribute, such as the prior month return. The datasets then show the return by month for each decile. Our charts below show the outcome of long/short strategies which own the top two deciles and are short the bottom two[2].
Low Prior Returns
Historically, January has been by far the best month to invest in stocks which have previously underperformed their peers. The Fama-French datasets show the outcomes of forming portfolios based on three prior periods of return:
- Long-term reversal: Investment return from five years ago to one year ago
- Momentum: Return from one year ago to one month ago
- Short–term reversal: Return of the prior month
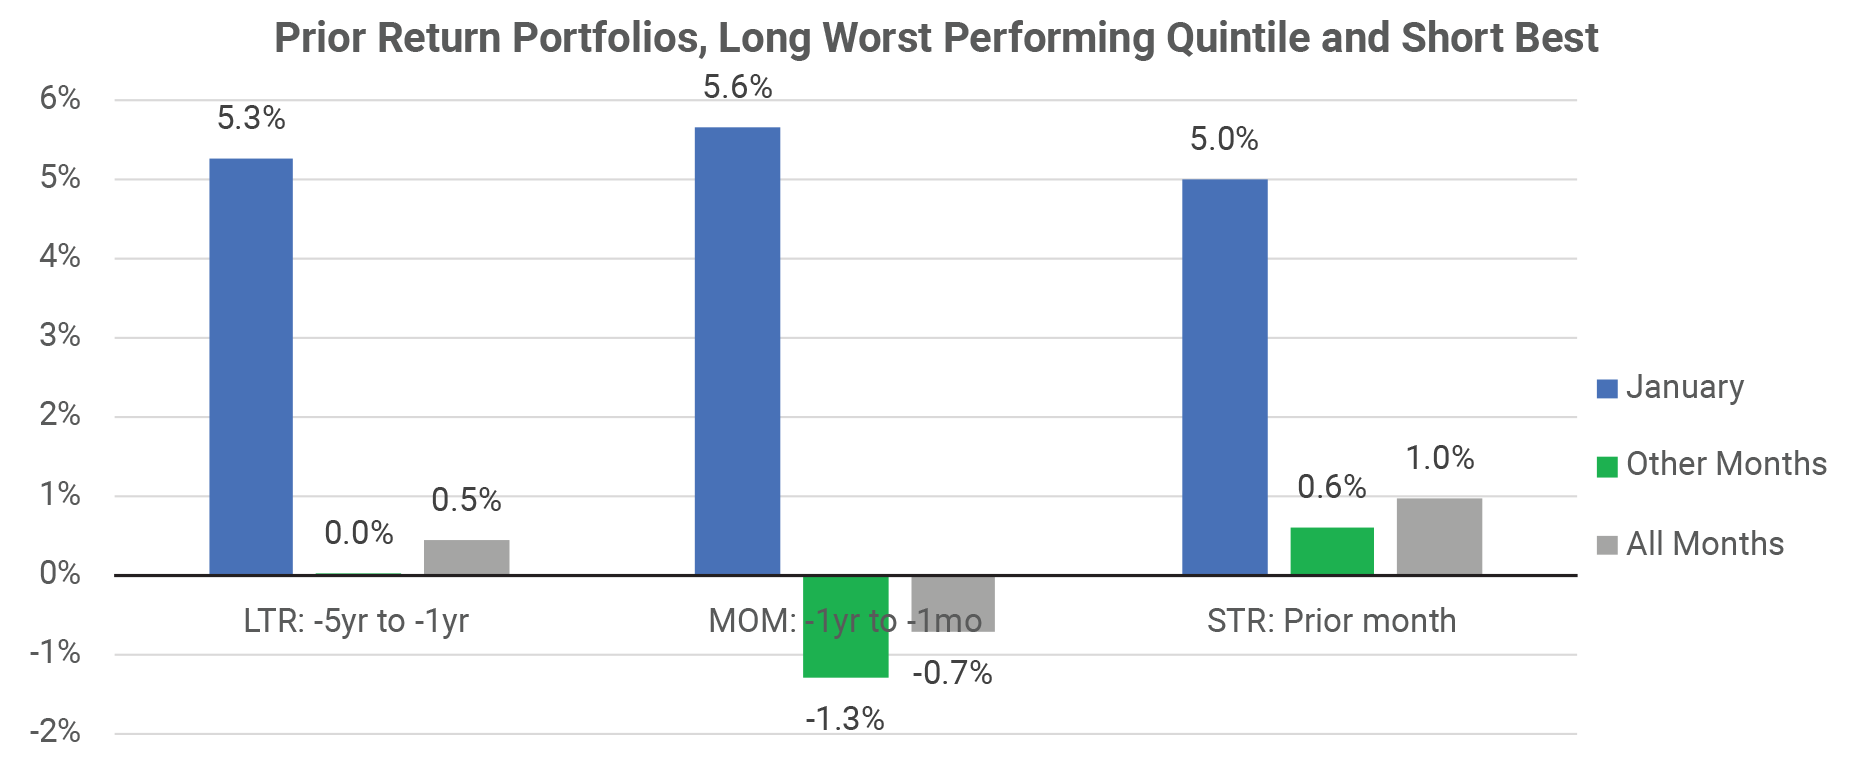
The following chart shows the outcome since 1963 of owning the worst performing quintile of stocks and being short the best performing quintile, using these three horizons of prior performance. In the month of January, the poor performers over any of these prior time periods outperformed the top performers by 5% or more, on average. For the other eleven months of the year, the impact of forming portfolios based on the returns over these prior periods is quite different:
- Long-term reversal: Essentially no impact
- Momentum: Opposite impact – better to own the best performers, not the worst
- Short-term reversal: Much smaller impact
Favorable Value
Historically, January has been the best month for investing based on value. The Fama-French online datasets identify three ways of ranking stocks based on their value:
- Cash flow to price: Favor stocks with the highest ratio of cash flow per share to price
- Earnings to price: Favor stocks with the highest ratio of earnings per share to price (lowest P/E ratio)
- Book to market: Favor stocks with the highest ratio of accounting book value to market capitalization
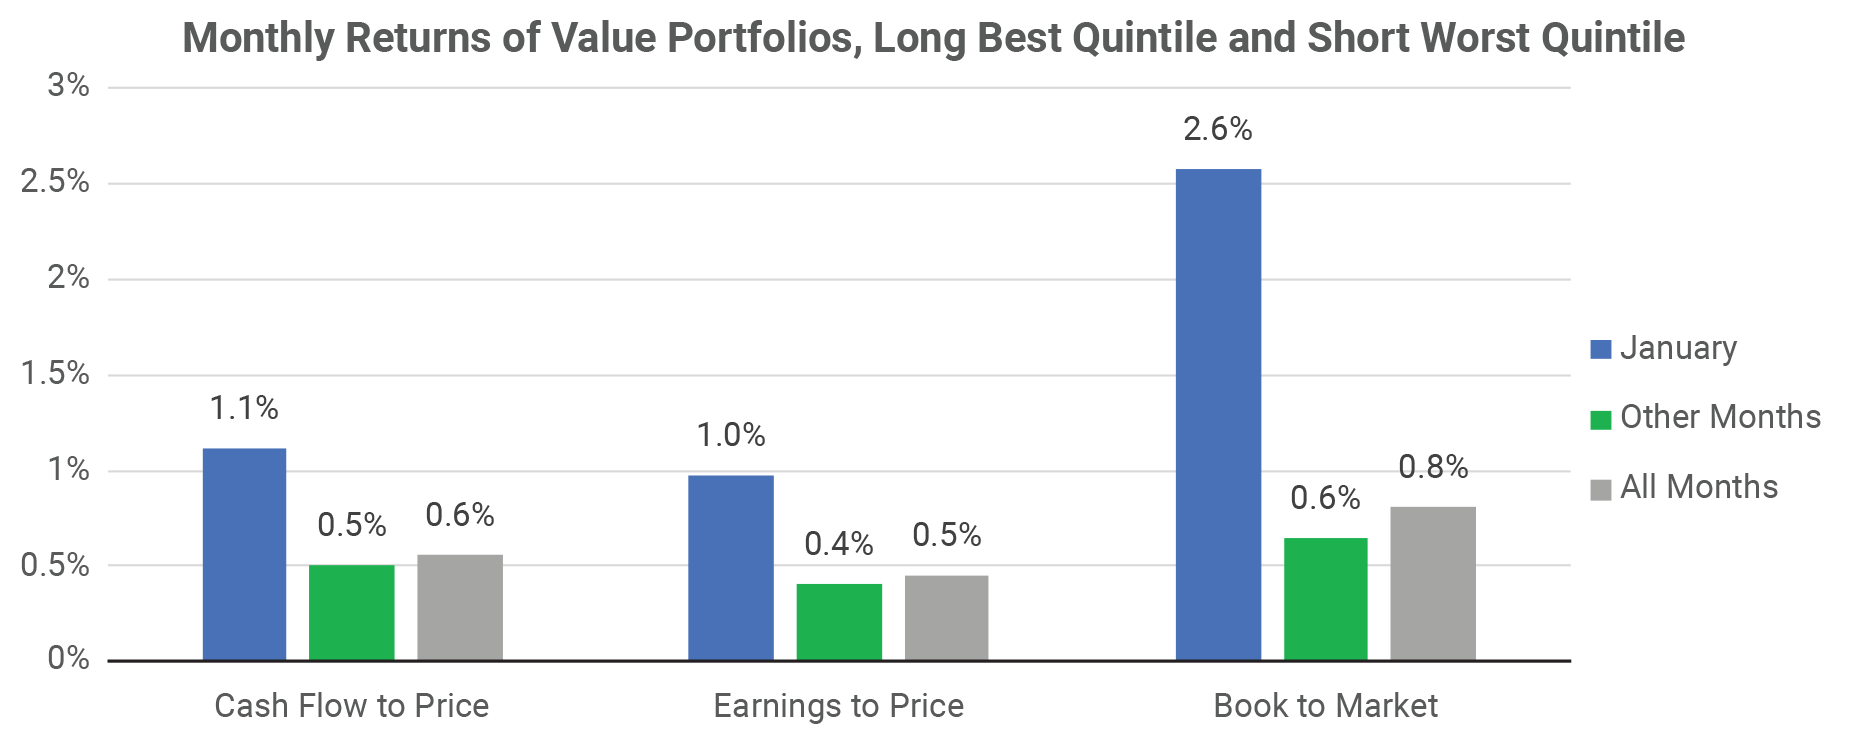
For each of these methods to determine value, one can derive the outcome of a long/short equity portfolio which is long the top quintile of stocks with the best value and short the bottom quintile. The following chart shows the average returns over the past sixty years for the month of January and for the other months. The benefit of investing based on these value metrics has been more than twice as high in January as in the other months.
High Volatility
On average, low volatility stocks have outperformed high volatility stocks, but not in January. Fama and French rank stocks based on their variance over the past 60 days. Over the past sixty years, a strategy of owning the 20% of stocks with the highest volatility and being short the 20% of stocks with the lowest volatility would have gained 5.7%, on average, every January. For the other eleven months, owning the low volatility stocks was better by 0.9% per month (10% per year).
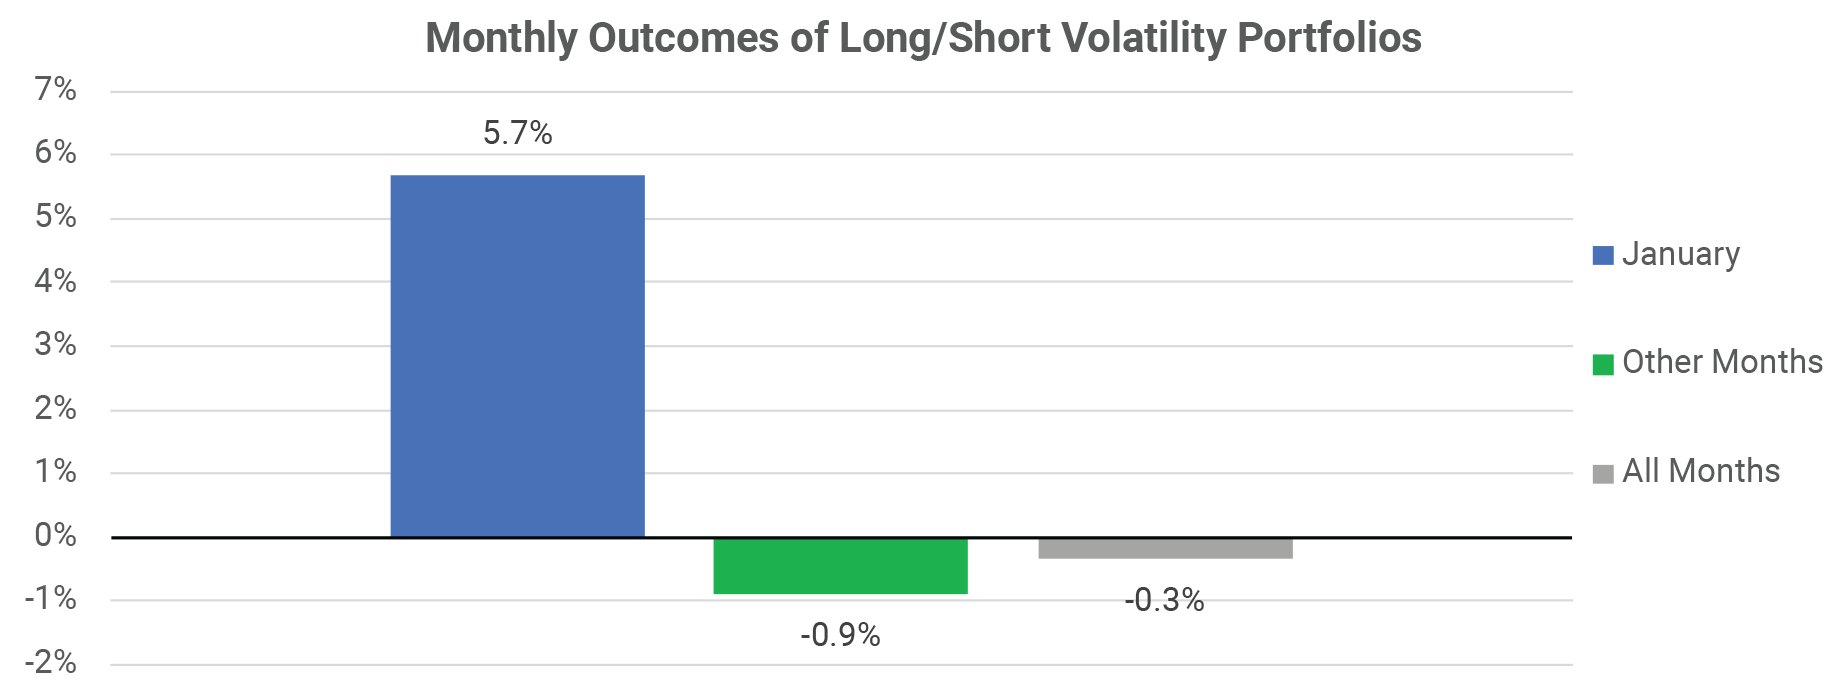
Explanation of January Effect
In December, taxable investors sell their equity losers to lower the tax bill for the year. Institutional equity portfolio managers engage in window-dressing – removing the least successful positions from the portfolio before year-end in order to have a more appealing set of holdings in year-end reports. This year-end selling can move stocks down to bargain prices which may then be exploited in January.
Investor risk appetite also tends to vary by season. The empirical evidence finds a gambling preference – lottery seeking behavior – at the beginning of the year. This may be because equity traders have budgets for risk-taking and drawdowns which reset as each new year begins. With a fresh budget for risk, investors can take a chance on highly volatile past losers with good value. Because of the volatility, if those stocks begin to outperform, the outperformance could be large.
Tendencies Strong in January 2023
Selecting stocks at the end of December 2022 based on these factor return tendencies would have led to excellent results in January 2023. We calculated a factor attractiveness score as of December 31, 2022 for the US stock indices, seeking low prior returns, favorable value and high volatility.
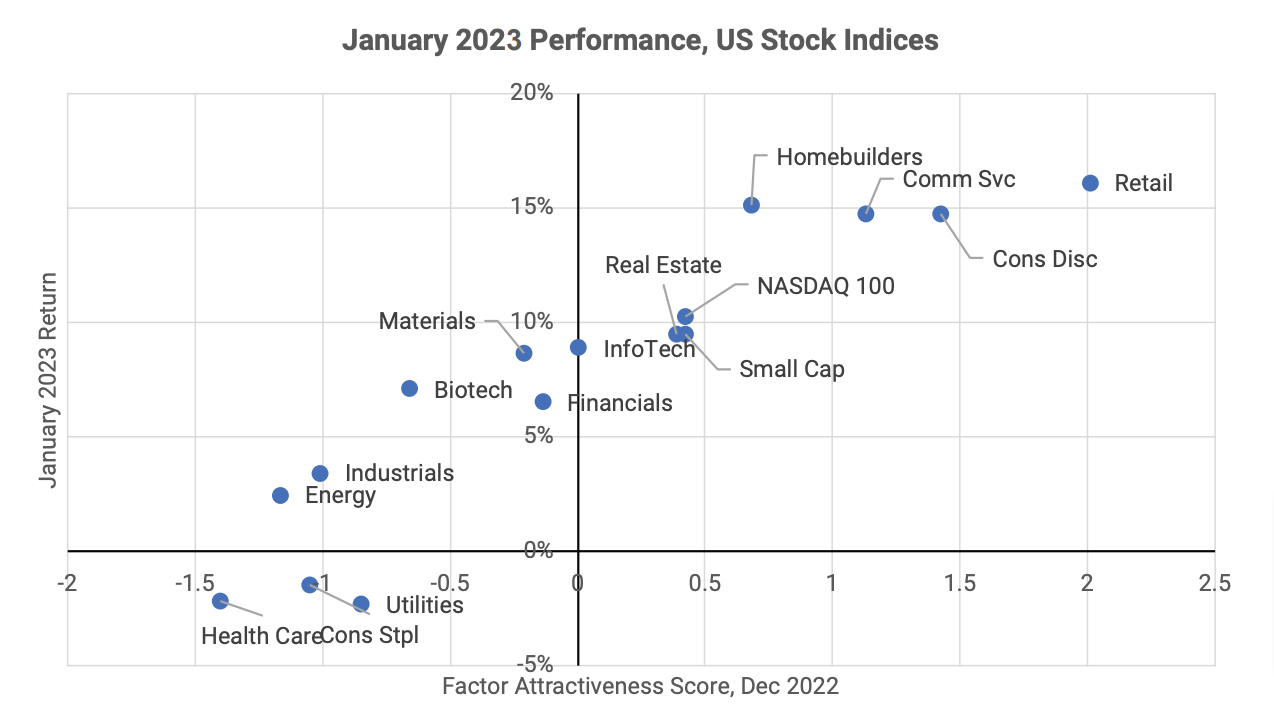
As the chart shows, there was a very strong relationship between the December 2022 attractiveness score and the January 2023 outcome. The correlation between the score and the January return is 0.92 – almost perfect. The lower volatility defensive sectors (e.g., Health Care, Consumer Staples) which had better performance in 2022 were the worst performing sectors in January 2023, while the higher volatility cyclical sectors which had poor performance in 2022 (e.g., Retail, Consumer Discretionary) were top performers in January. A fund manager who selected stocks based on these factor tendencies would have had an excellent first month of 2023.
What About January 2024?
The list below shows the ranking of US sectors as of December 2023 using the same methodology as for December 2022. The order of this ranking is nearly the opposite of the December 2022 ranking. The sectors which had stellar performance in 2023, including any sector with a “Magnificent Seven” stock in it, rank low for January 2024, because the prior returns are high and value metrics are not favorable. Whereas sectors like Energy and Utilities, which have good value and negative returns in 2023, have moved to the top of the list.
1. Energy
2. Utilities
3. Consumer Staples
4. Financials
5. Retail
6. Materials
7. Health Care
8. Real Estate
9. Small Cap
10. Industrials
11. Communication Services
12. Consumer Discretionary
13. Biotech
14. Homebuilders
15. NASDAQ 100
16. Information Technology
Summary
There is an extensive body of research by Fama, French and others which demonstrates that factors such as value and momentum influence the future returns of stocks. Using the Fama-French data, one can show that the influence of these factors has been stronger in January than in other months. For momentum and volatility, the effect has an opposite sign in January relative to other months. An equity investor with this knowledge can configure investment portfolios each December with better odds of favorable outcomes in January. These observed historical patterns explain the January 2023 market outcomes well. They would also imply that January 2024 would be a good time to cut back on holdings of the types of high-flying technology stocks which led stock market performance last year. These patterns, while historically strong, will have exceptions from time to time. And an investor needs to be nimble – any positioning which is specific for January effects is less likely to succeed in other months.
[1] https://mba.tuck.dartmouth.edu/pages/faculty/ken.french/data_library.html
[2] The Fama-French returns do not include trading costs or costs of shorting and therefore tend to overestimate the returns which might be achieved in practice.
Disclaimer:
The information provided in this article by Atlas Capital Advisors Inc., a registered investment advisor (RIA), is intended for general informational purposes only and should not be considered as professional tax advice. While we strive to ensure the accuracy and timeliness of the content, tax laws are complex and subject to change. This article does not establish a client-advisor relationship, and individuals are encouraged to consult with qualified tax professionals for personalized advice tailored to their specific situations. Atlas Capital Advisors Inc. disclaims any responsibility for actions taken or not taken based on the information provided herein and makes no warranties regarding the accuracy or completeness of the content. The use of this information is at the reader’s own risk, and Atlas Capital Advisors Inc. is not liable for any direct or indirect damages arising from the use of this article.


